Debugging PineTime Smart Watch firmware with Raspberry Pi 4 running VSCode
Debug Rust+Mynewt Firmware for PineTime on Raspberry Pi
UPDATE: This code in this article has been archived in the pre-lvgl branch of pinetime-rust-mynewt. The pinetime-rust-mynewt firmware has been revamped to support Rust Watch Faces on LVGL. Check out the updates
Using only a Raspberry Pi, we can debug the firmware on PineTime Smart Watch: Step into the flashed program line by line, set a breakpoint to pause execution at a line, inspect variables at runtime, … Just like the Embedded Pros!
It’s a great way to learn how real IoT gadgets are created… At a fraction of the cost of professional embedded tools and workstations!
Here are the steps to configure a Raspberry Pi (1, 2, 3 or 4, with 1 GB RAM or more) for debugging the Rust+Mynewt Firmware for PineTime…
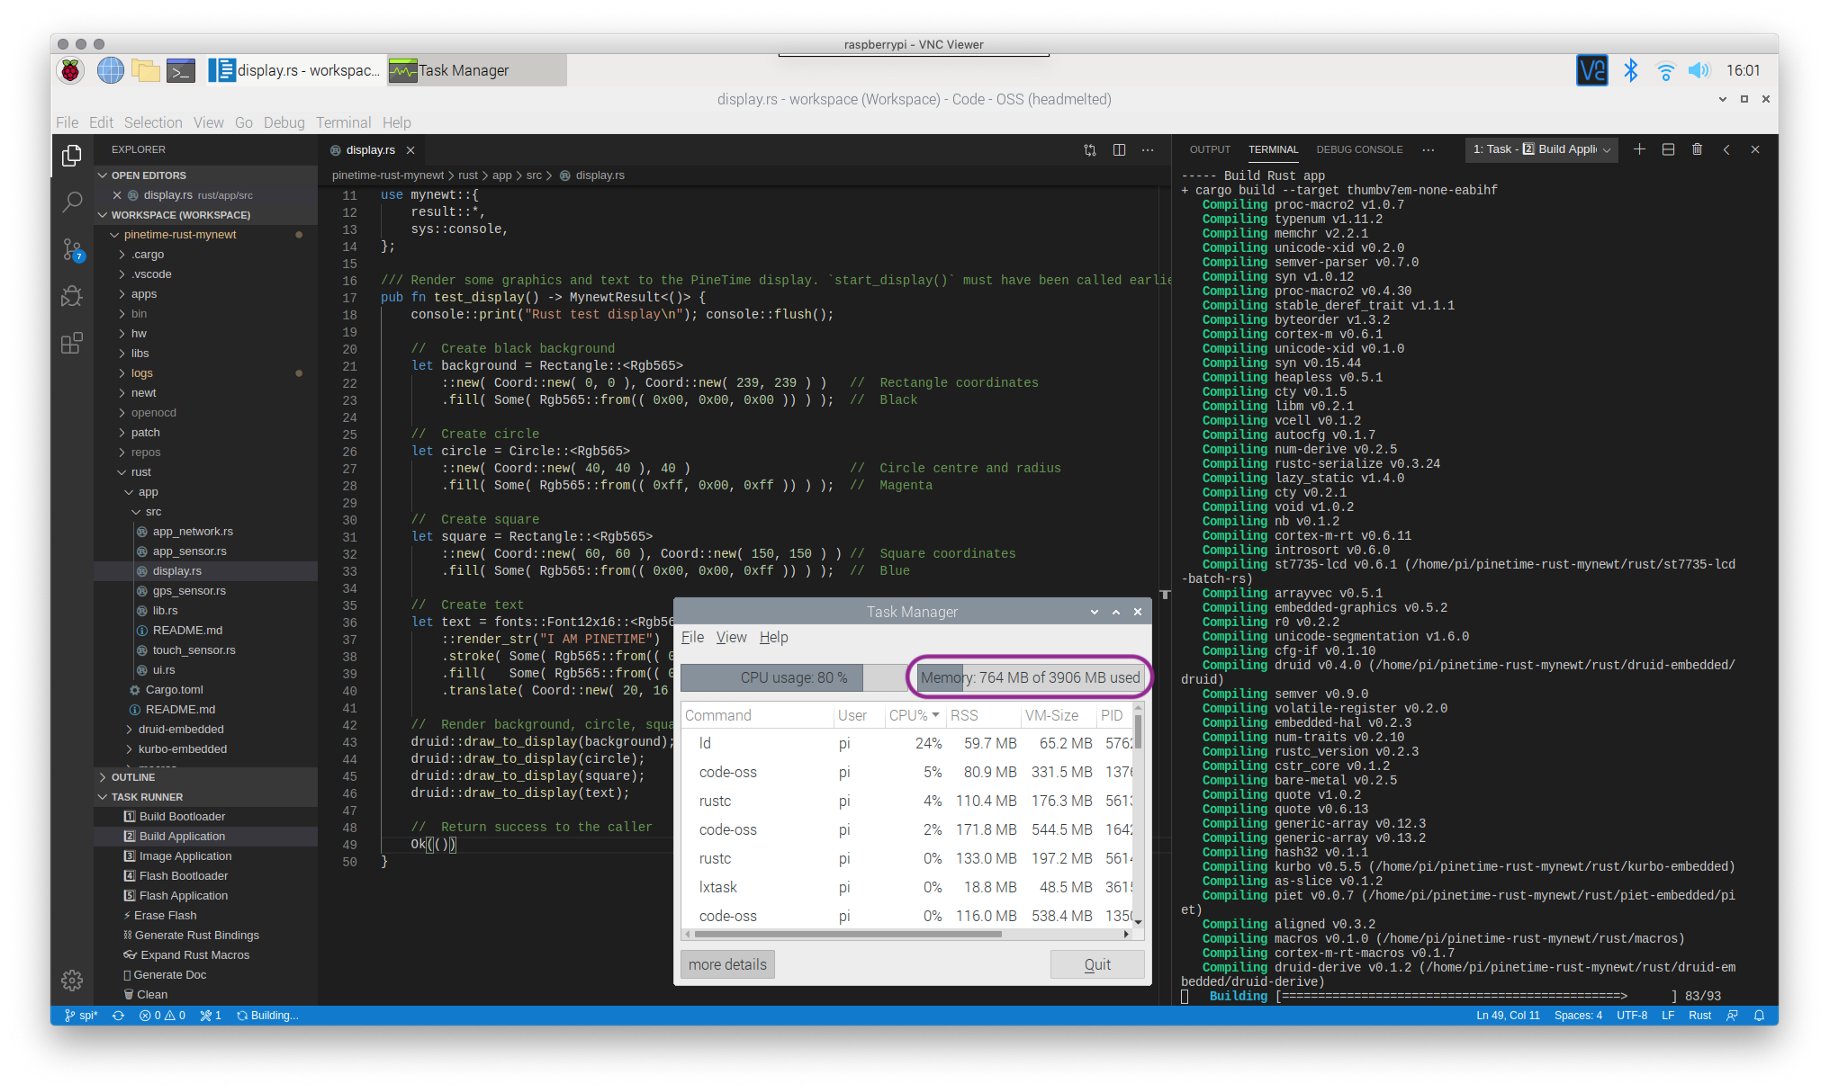
Debugging PineTime Firmware with VSCode on Raspberry Pi 4. Requires under 600 MB of RAM.
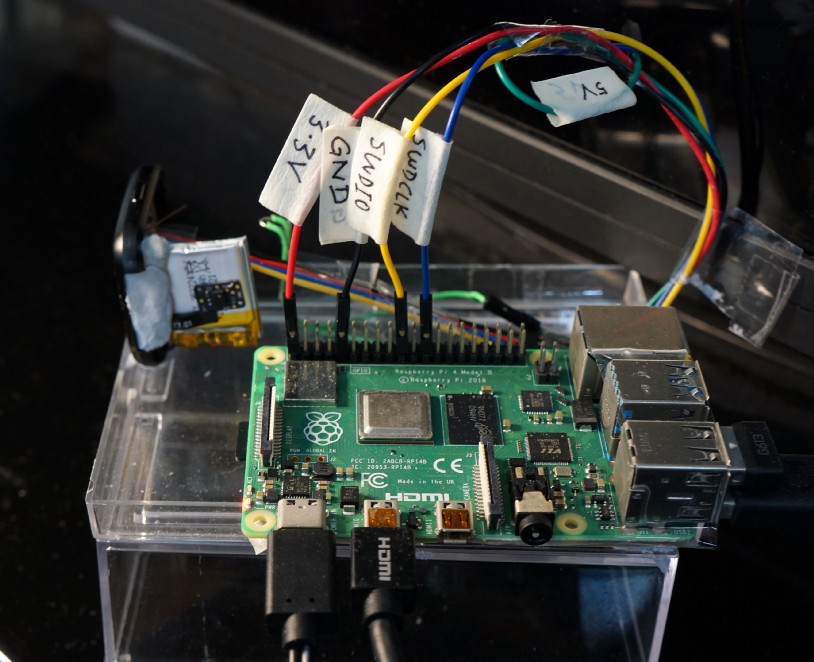
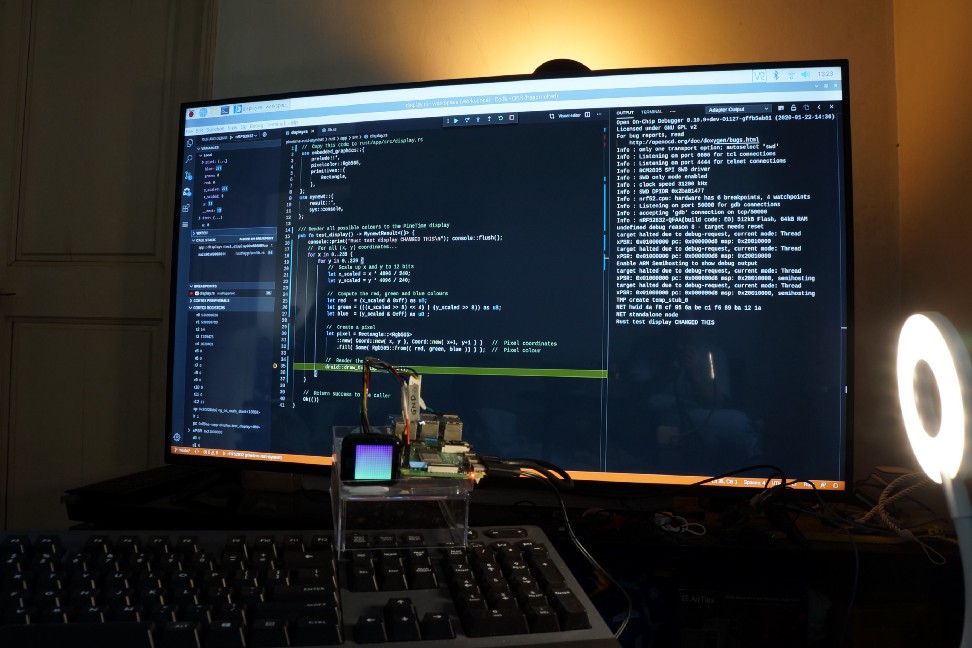
Raspberry Pi connected to PineTime for flashing and debugging firmware
Build and Flash Firmware to PineTime
First we prepare PineTime for development by erasing the demo firmware and replacing it by our own firmware. This only needs to be done once.
Follow the instructions in the article “Build and Flash Rust+Mynewt Firmware for PineTime Smart Watch” under the following sections…
- “Connect PineTime to Raspberry Pi”
- “Remove PineTime Flash Protection”
If you have installed the PineTime tools before 23 Jan 2020, please redo the above steps to get the latest updates
🛈 What is “flash memory” / “flashing” / “firmware”? Read this
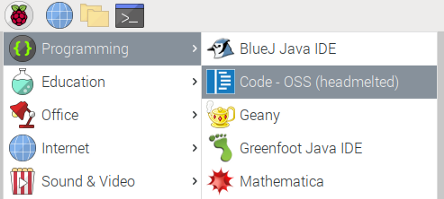
1️⃣ Launch VSCode by clicking the Raspberry Pi Menu (top left corner) → Programming → Code OSS Headmelted
Launching VSCode on Raspberry Pi
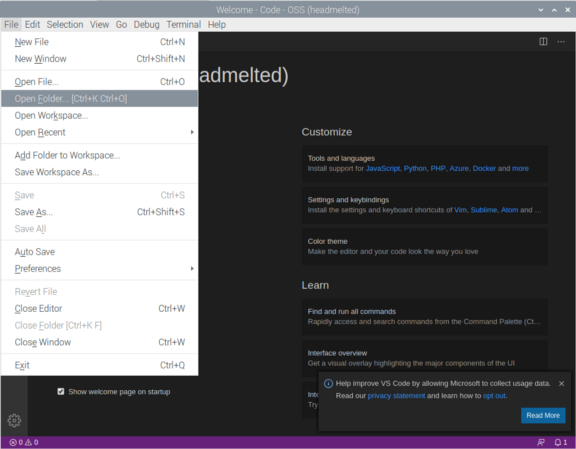
In VSCode, click File → Open Folder
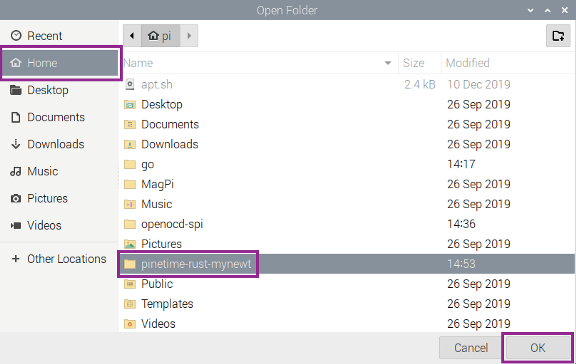
Under Home, select the folder pinetime-rust-mynewt and click OK
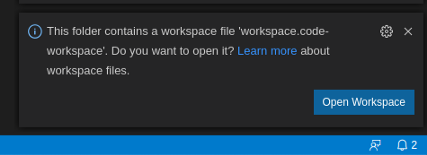
When prompted to open the
workspace, click Open Workspace
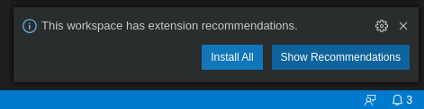
When prompted to install
Extension Recommendations, click Install All
Ignore the message Unable To Watch For File Changes. Close the message when it appears.
2️⃣ At the lower left corner,
there is a panel Task Runner. Click the panel to display the
tasks.
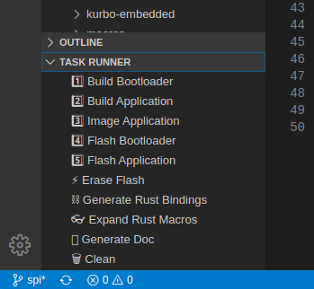
In the Task Runner, click [1] Build Bootloader
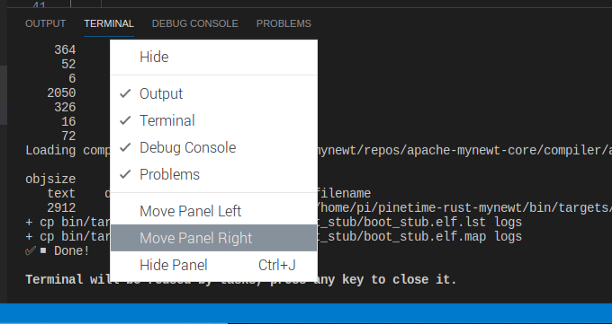
When the Terminal Panel appears,
right-click the Terminal tab, select Move Panel Right
After the building the
Bootloader, we should see Done…
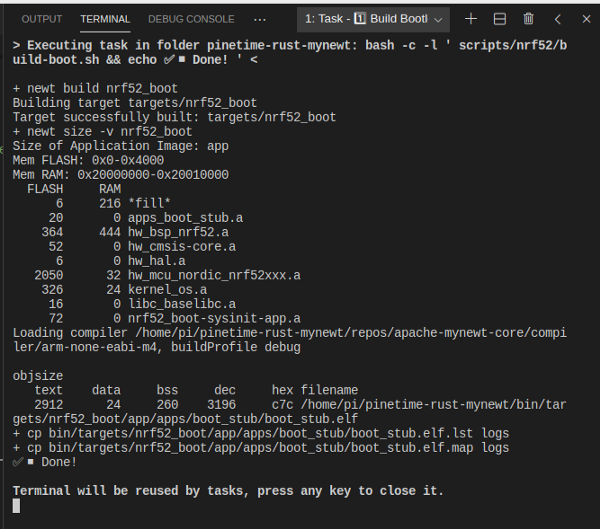
Ignore the message There Are Task Errors
🛈 What is a Bootloader? Read this
3️⃣ In the Task Runner, click
[2] Build Application
After the building the
Application, we should see Done…
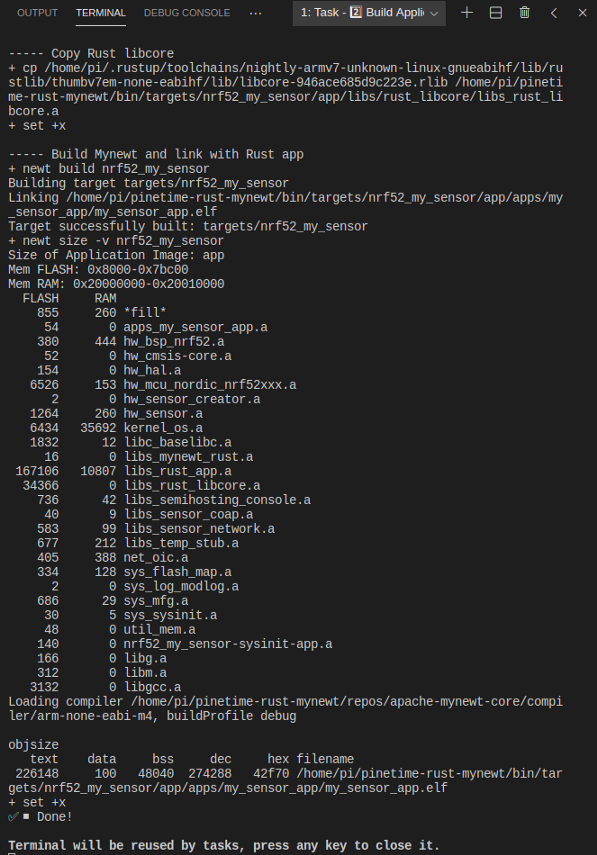
If you see the message Undefined Reference To Main, click [2] Build Application again and it should succeed.
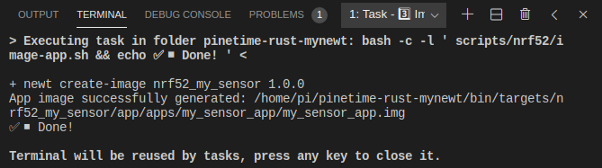
4️⃣ In the Task Runner, click
[3] Image Application
After the creating the Firmware
Image, we should see Done…
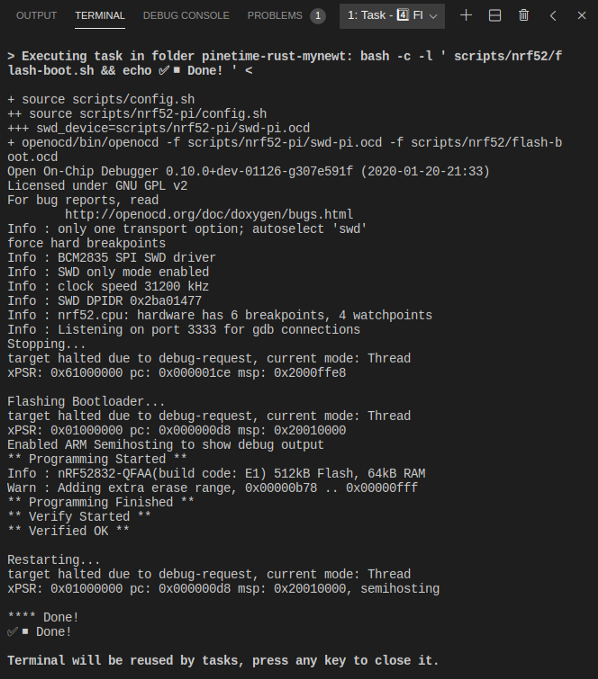
5️⃣ In the Task Runner, click
[4] Flash Bootloader
After flashing the Bootloader
Firmware to PineTime, we should see Done…
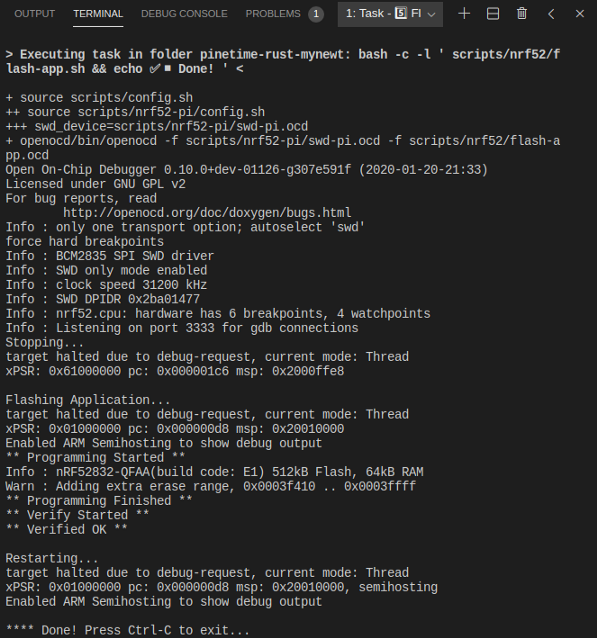
6️⃣ In the Task Runner, click
[5] Flash Application
After the flashing the
Application Firmware to PineTime, we should see Done…
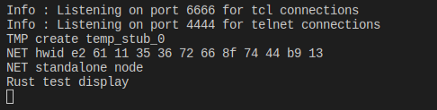
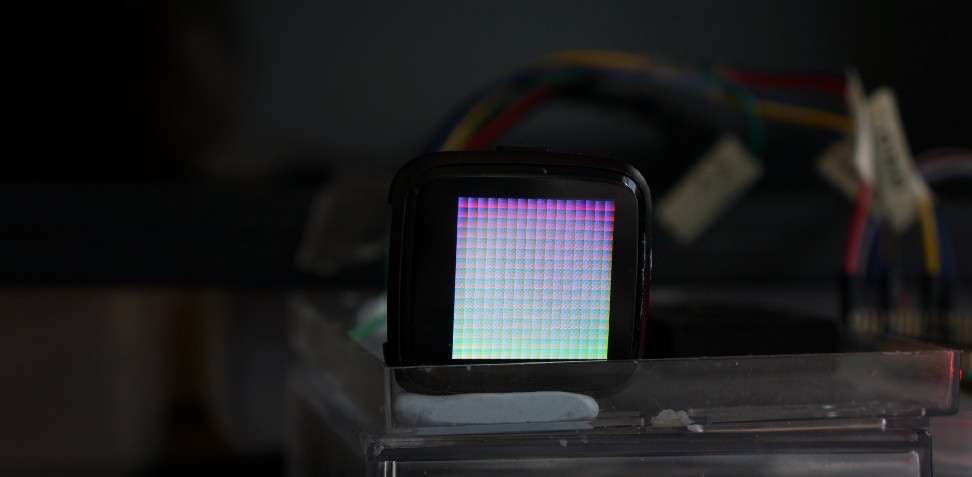
7️⃣ Our Rust application starts running on PineTime…
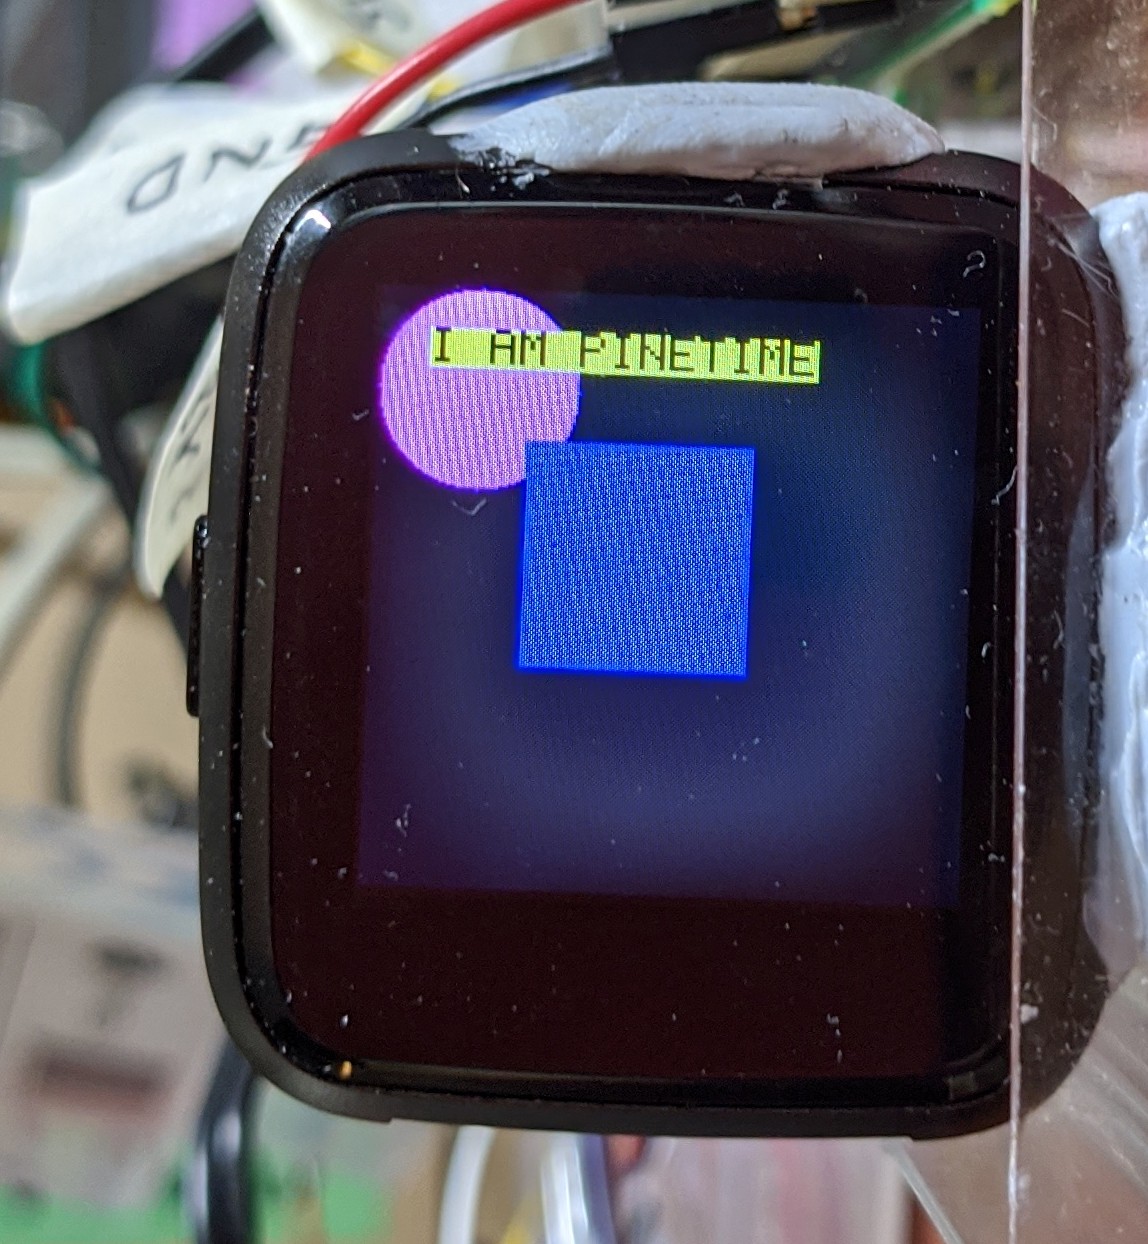
Our Rust Application rendering graphics and text to the PineTime display
Here are the debugging messages generated by our application…
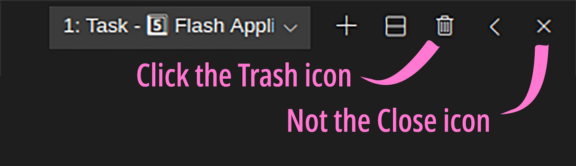
8️⃣ Click the Trash icon 🗑 near the top right to terminate the application. If we click the Close icon ❌ instead of the Trash icon, the next flash or debug command will fail.
Here’s a walkthrough of the steps to Build and Flash Firmware to PineTime…
Building and Flashing Firmware to PineTime with VSCode
Debug PineTime Firmware
Now that the Bootloader Firmware and Application Firmware have been flashed, we are ready to debug the firmware on PineTime…
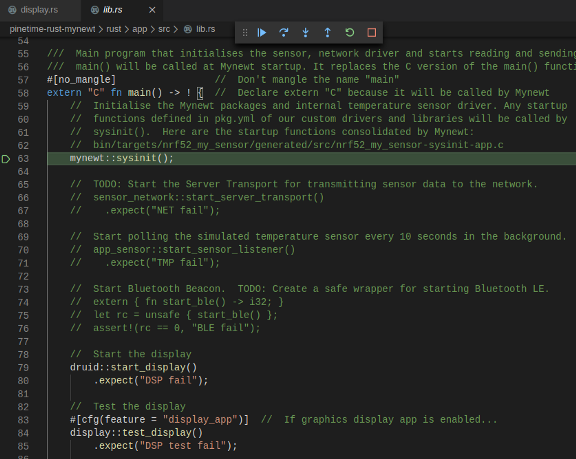
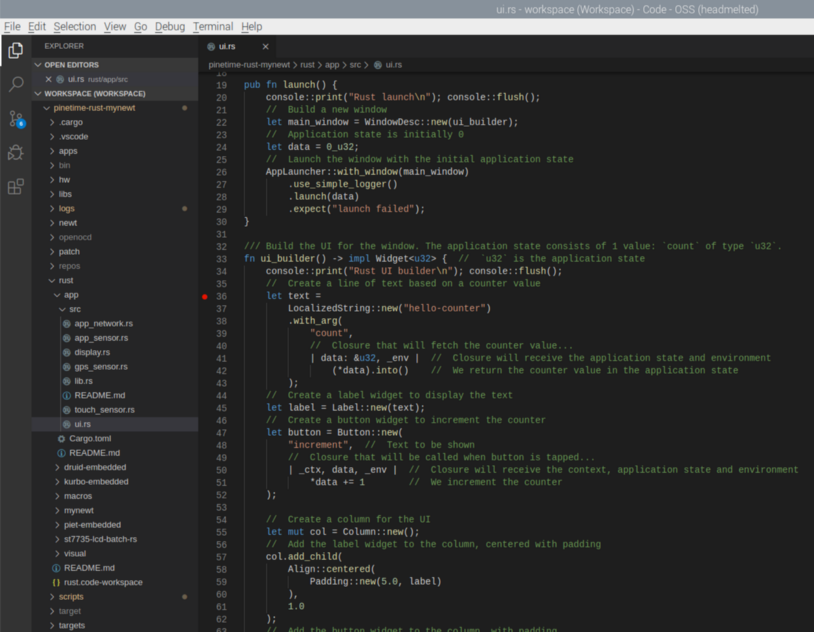
1️⃣ In VSCode, edit the Rust
application located at rust/app/src/display.rs
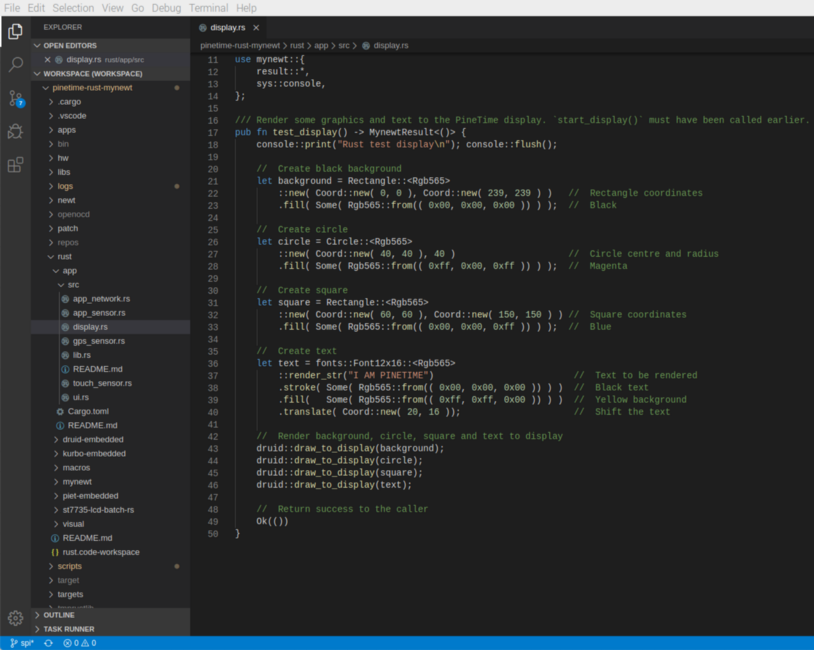
Editing the Rust application in VSCode
This is a simple function test_display that’s called by our Rust Application to render some
text and graphics to the PineTime display. Here’s a good
introduction to Rust programming
Change I AM PINETIME to your own message
Click File → Save (or Ctrl-S) to
save the file
2️⃣ In the Task Runner, click
[2] Build Application
Wait for the Application to be built…

If you see the message Undefined Reference To Main, click [2] Build Application again and it should succeed.
3️⃣ In the Rust function test_display, look for the first line that calls the function draw_to_display (Line 43)
Click the empty space to the left of Line 43. A red dot should appear like this…
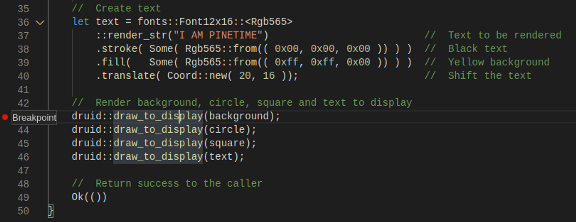
We have set a Breakpoint. When PineTime executes the firmware to that point, it will pause the execution.
In a while we’ll discover for
ourselves how the PineTime firmware runs:
Reset Handler → main Function → test_display
Function
4️⃣ Click Debug → Start Debugging or press F5
This starts the VSCode Debugger and automatically flashes our updated firmware to PineTime.
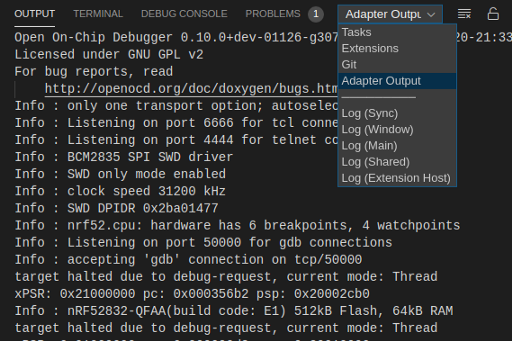
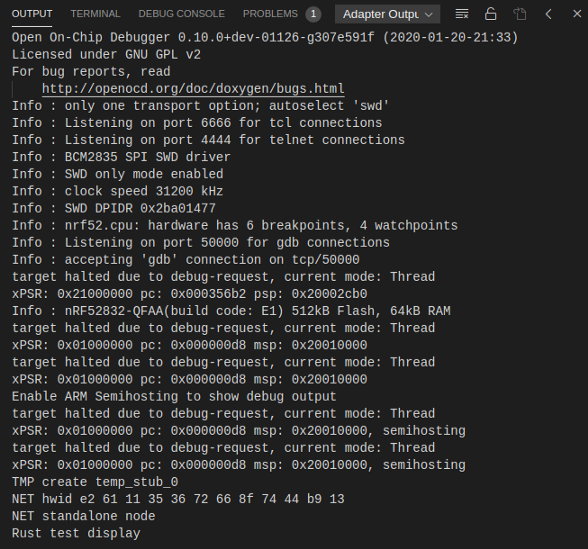
Click View → Output
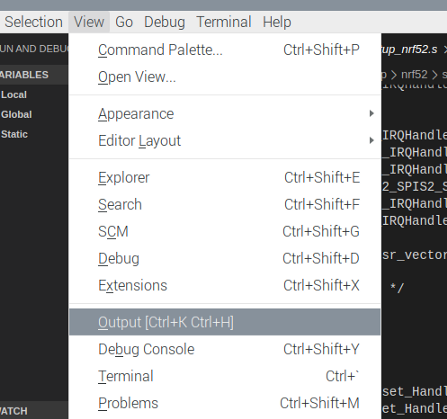
In the Output Panel, select Adapter Output
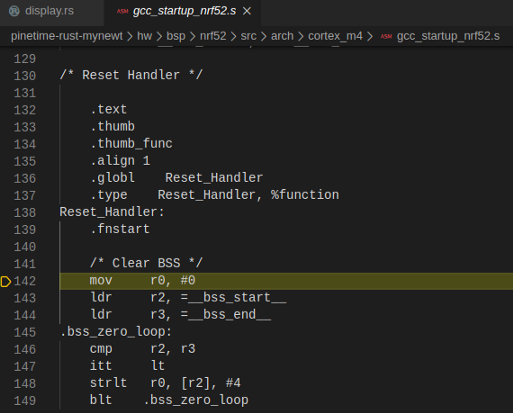
5️⃣ The program has paused at first line of code in our firmware, the Reset Handler.
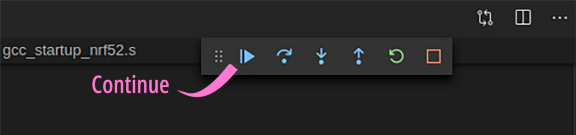
In the Debug Toolbar, click Continue or press F5
🛈 What’s a Reset Handler? Read this
6️⃣ The debugger now pauses at
the first line of the main function that’s defined in rust/app/src/lib.rs
This is the first line of Rust
code in our Rust Application, which will call test_display in a
while.
In the Debug Toolbar, click Continue or press F5

🛈 What’s a
main function? Read
this
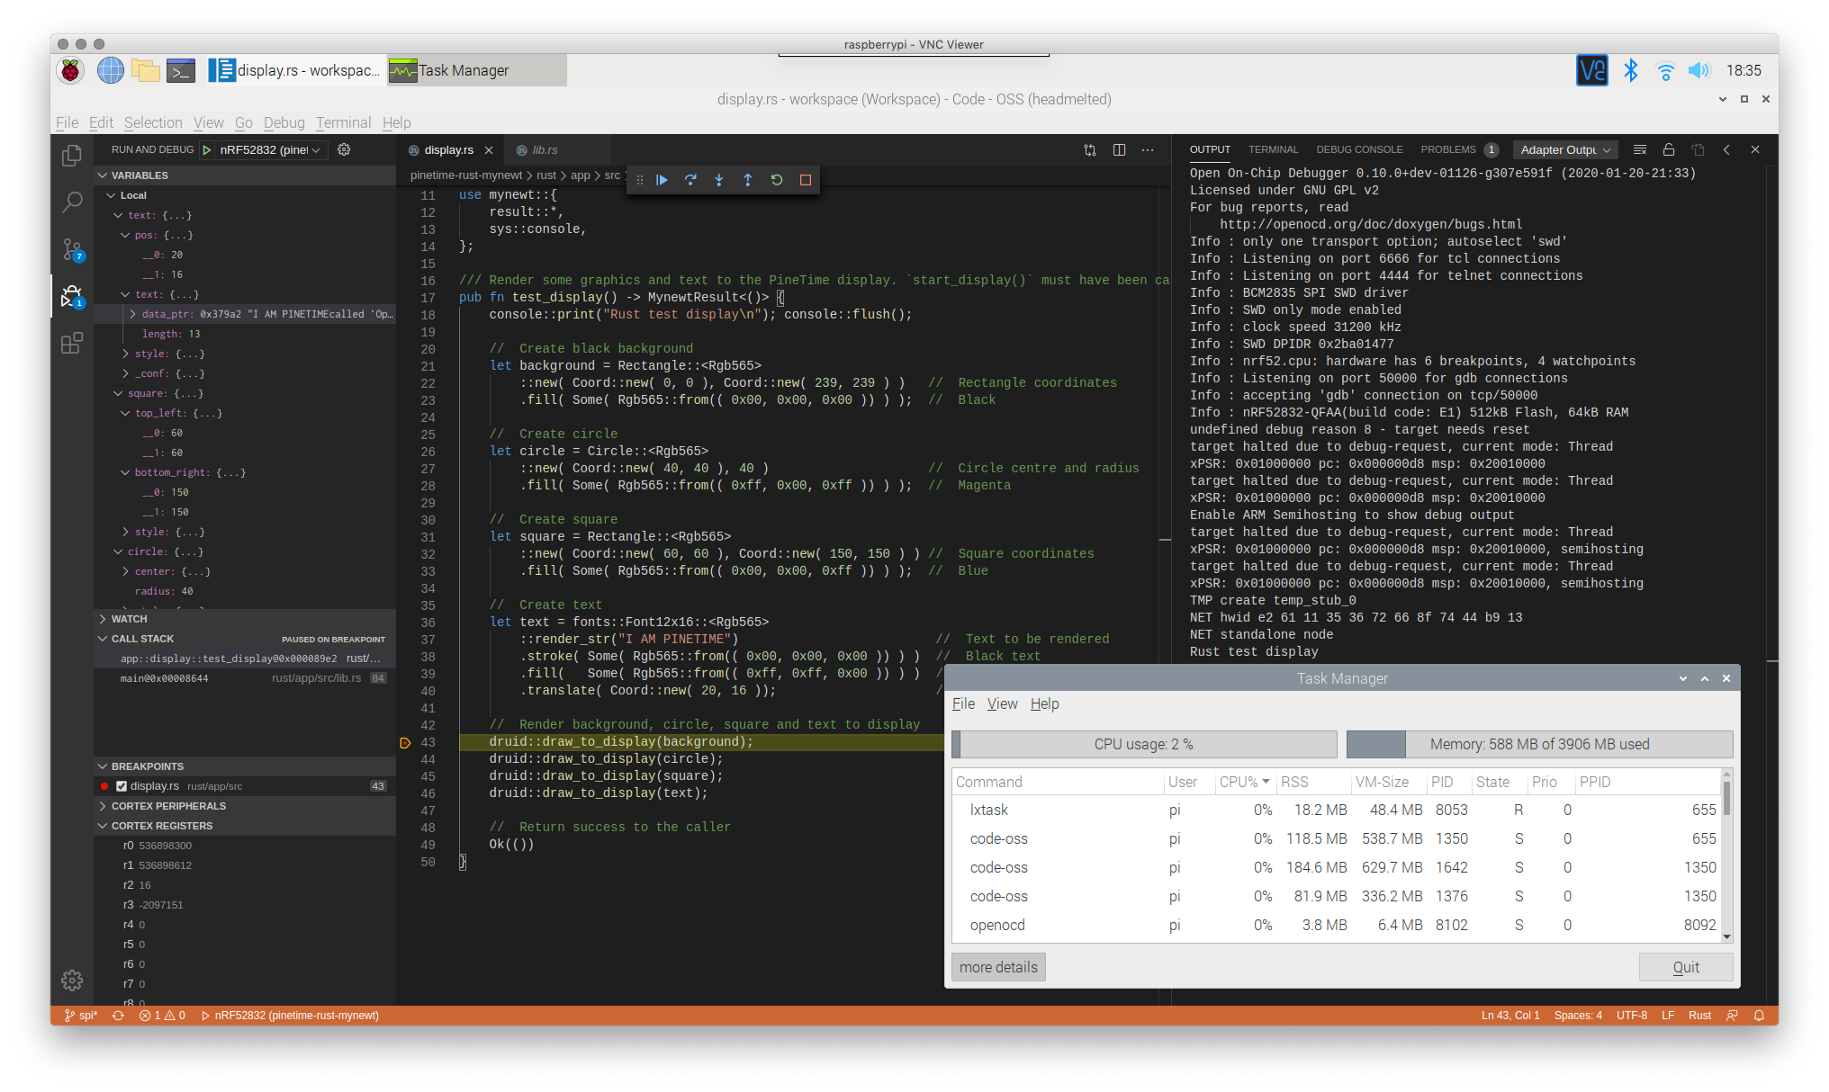
7️⃣ The debugger pauses at the Breakpoint that we have set earlier…
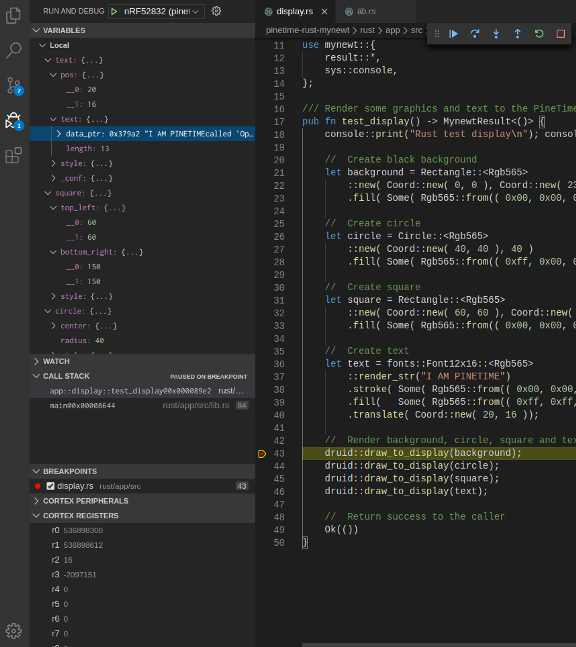
Now we may inspect the Rust variables live, as our firmware runs.
Expand the Variables Panel at top left to inspect the Rust variables for our graphical
objects: background, circle, square, text. We can see the screen coordinates that have been set for each
graphical object, as well as the text string.
Below that, the Call Stack Panel shows the callers of this function. Click on a caller to see the calling location.
Output Panel → Adapter Output at right shows the debugging messages generated by our Application…
🛈 Why are the strings mashed together? Read this
8️⃣ Here are the other buttons in the Debug Toolbar…
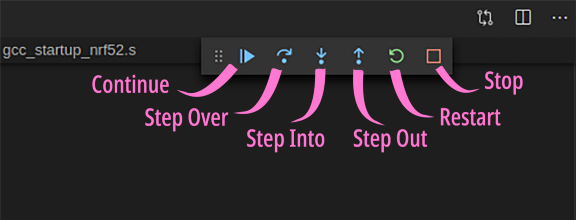
Debug Toolbar
Continue: Continue execution of our firmware until the next Breakpoint
Step Over: Step over the code line by line. The variables will magically reveal themselves one by one after stepping over each line of code! Here’s how it works… 抖音视频
Stepping Over with PineTime Debugger
Step Into: Same as Step Over, except that it steps into functions. Useful for diving into Rust library functions and Mynewt system functions. Here’s how it works… 抖音视频
Stepping Into with PineTime Debugger
(In the last part of the video, I clicked the Call Stack to see the variables in the calling function)
Step Out: Continue execution until the current function returns
Restart: Stop the execution and start from the beginning
Stop: Stop the debugger
9️⃣ When’re we done with
debugging, click Stop
When we modify any code in our
Rust Application, we only need to click [2] Build Application
before starting the debugger. The debugger will flash our updated firmware automatically to PineTime.
Here’s a walkthrough of the steps to debug PineTime Firmware…
Debugging PineTime Firmware on Raspberry Pi
💎 The number of Breakpoints that we may set through the debugger is limited to 2 or 3, constrained by the nRF52 Microcontroller in PineTime. Step Over / Step Into / Step Out also counts as one Breakpoint. So it’s easy to run out of Breakpoints while debugging.
Instead of setting Breakpoints via the debugger, we may trigger an unlimited number of Breakpoints in our Rust code by inserting the line below (here’s an example)
cortex_m::asm::bkpt();
Debug Rust Loops on PineTime
Here’s a more complicated Rust Application, with nested loops!
What does it do? Tip: “u8” refers to an 8-bit unsigned integer (uint8_t for C folks)
This Rust program has hardcore bitwise operators | and &, plus shifty operators like << and >>
What do you think this Rust program does? Let’s find out…
1️⃣ Copy this code and overwrite the contents of rust/app/src/display.rs
2️⃣ Set a Breakpoint at the line for x in ...
3️⃣ Click [2] Build Application
4️⃣ Click Debug → Start Debugging or press
F5
5️⃣ When execution pauses at Reset Handler and at the main Function, click Continue in the
Debug Toolbar, or press F5
Click Step Over for the code above. Watch as
the variables change inside the loop. Can you figure what that the Rust code is doing?
Bitwise operators are important for embedded developers… Because we often manipulate individual bits, like colours and pixels!
Trick Question: Given the Rust code below, will x be set to 239 eventually? Step Over
the above code with a debugger and you’ll discover one of Rust’s interesting quirks!
for x in 0..239 { ...
Here’s the answer… This Rust program renders all possible colours to the PineTime screen!
Debug Interactive Firmware for PineTime
Feeling adventurous? Try debugging an interactive application for PineTime… A Rust Application that responds to your touch!
1️⃣ Follow the instructions in the article “Build and Flash Rust+Mynewt Firmware for PineTime Smart Watch” under the section “Advanced Topic: Build druid UI Firmware for PineTime”
Modify Cargo.toml to enable ui_app
(and disable display_app). Save the file.
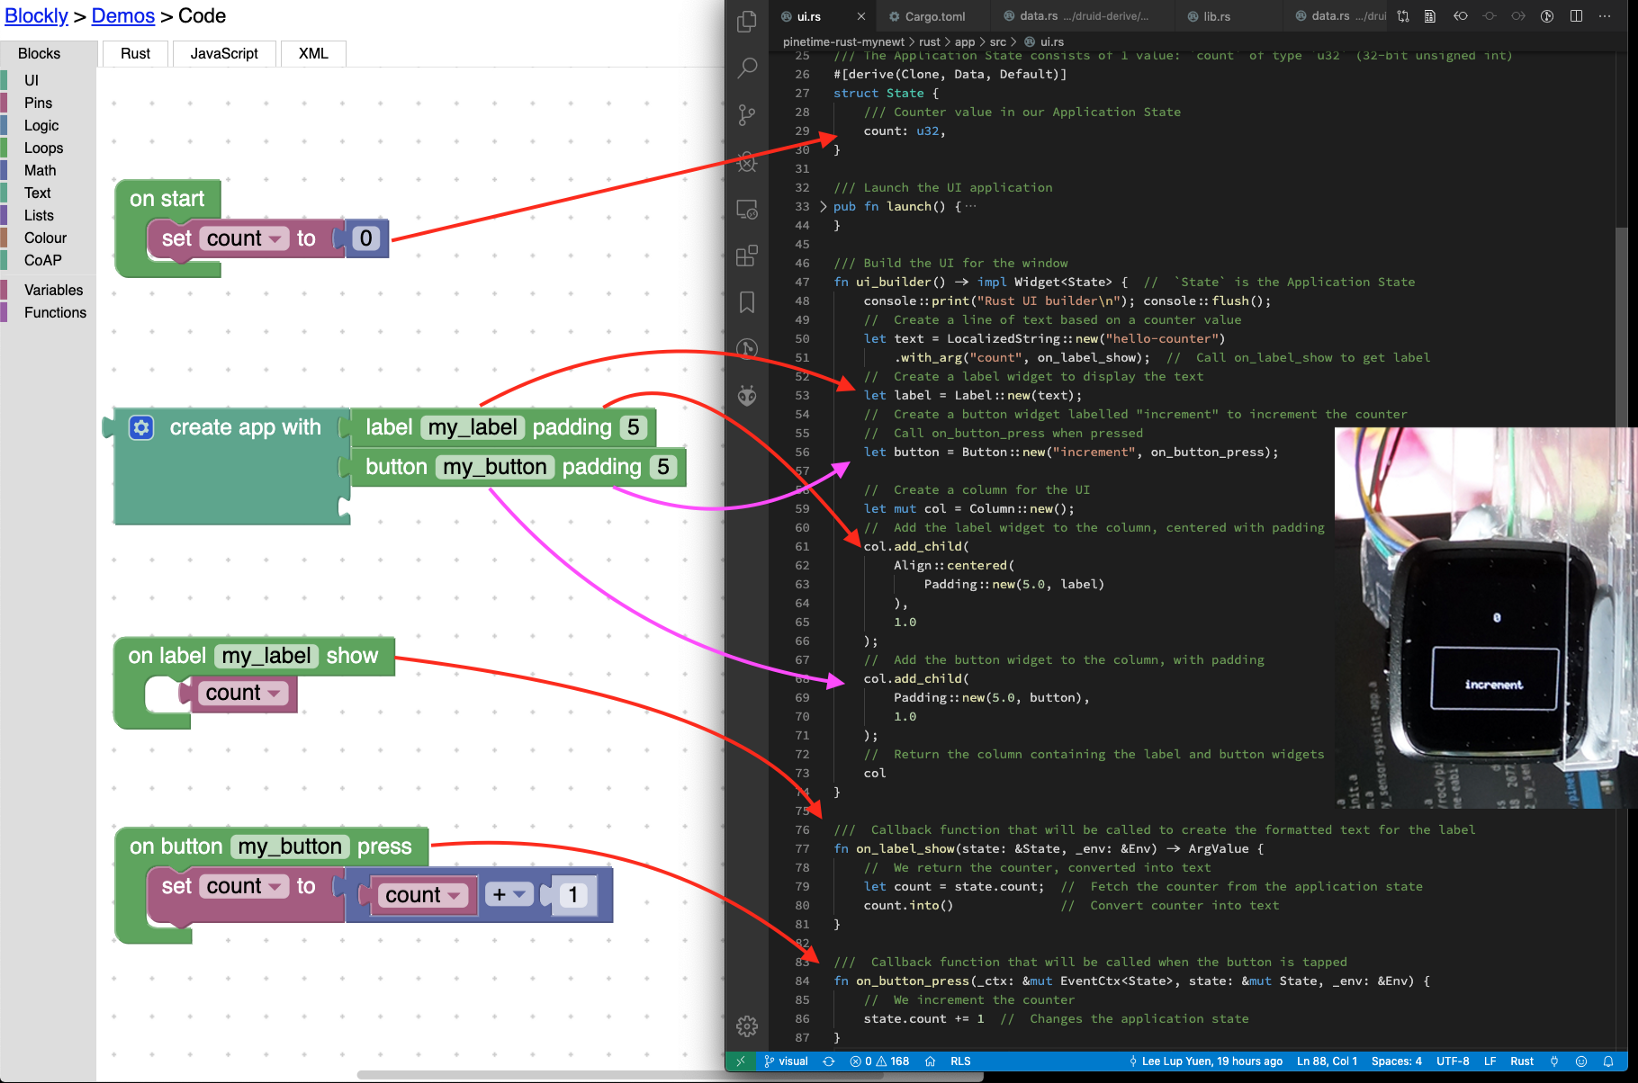
2️⃣ Open the file rust/app/src/ui.rs.
This file contains two Rust functions: launch and ui_builder
Setting a breakpoint at the ui_builder function in rust/app/src/ui.rs
Set a Breakpoint inside the ui_builder function, at the line that says let text = ...
3️⃣ Click [2] Build Application
Click Debug → Start Debugging or press F5
The flow of firmware execution
now becomes…
Reset Handler → main Function → launch Function → ui_builder
Function
When execution pauses at Reset
Handler and at the main Function, click Continue in the Debug Toolbar, or press F5
When execution pauses at the
ui_builder Function, click Step Into a few times
We’ll see that this function goes a lot deeper, from…
- druid Library, for user interface widgets, to…
- piet Library, for 2D graphics, to…
- kurbo Library, for computing curves, to…
- embedded-graphics Library, for rendering graphics, to…
- Mynewt OS, for sending rendering commands to the display controller, also for handling touch events from the touchscreen controller
Remember: The Call Stack is always there to help if you get lost!
Interactive Firmware for PineTime that we’re debugging
Your IoT Learning Journey with PineTime
The skills that we have learnt today for debugging PineTime Firmware: stepping through code, setting breakpoints, inspecting variables… Are the same skills that I used for creating professional IoT devices (based on STM32 and Nordic nRF52 microcontrollers) connected with Bluetooth, WiFi, NB-IoT and Sigfox networks! (Check out my articles)
Congratulations, you’re now an experienced Embedded IoT Developer!
To sharpen your skills as an Embedded IoT Developer, check out the other articles in the PineTime series to learn hands-on… What really happens inside a real-world IoT gadget like PineTime…
1️⃣ I2C (Inter-Integrated Circuit) is a common way to connect components inside commercial IoT gadgets. In PineTime, I2C connects the nRF52 Microcontroller to the component that detects touching on the screen (called the Touch Controller).
Read on to learn why I2C works like a Light Rail train system (with Ghost Stations, possibly). How do we work with hardware components with incomplete documentation? (Happens frequently with IoT projects) Let me show you how I did it!
2️⃣ SPI (Serial Peripheral Interface) is another type of connection that’s commonly found inside IoT gadgets. In PineTime, SPI is used by the nRF52 Microcontroller to blast graphics at high speeds (8 MHz) to the colour LCD display.
But Speed is meaningless without Control… We’ll learn to group multiple display updates into a single SPI request, for higher throughput. We’ll also learn about the classic Space-Time Trade-Off… The more RAM you throw at the task, the faster it runs!
We’ll also dive into Apache Mynewt, the embedded operating system that shields us from the Bare Metal hardware. And its nifty low-level tricks (like Non-Blocking SPI) that will make PineTime fly. Beware: This article has plenty of fun experiments to optimise PineTime!
PineTime Challenge: Can you make graphics rendering even faster? More details here
3️⃣ PineTime has an interactive touchscreen that supports Watch Apps. This presents an interesting problem… How do we actually program Watch Apps for PineTime?
Programming Watch Apps for PineTime is surprisingly similar to Pebble’s Watch Apps. We apply the same concepts to lay out the user interface and respond to touch… Except that we do them in Rust instead of C.
Discover how complex embedded software (with many layers) can run on a tiny gadget like PineTime… With a bit of memory optimisation.
PineTime Challenge: Can we install Watch Apps on PineTime separately from the OS Firmware, perhaps via Bluetooth download? Here’s my proposed design
Here’s one way to build Watch Apps for PineTime through graphical programming (like Scratch)…
Here’s how we may run Retro Games on PineTime…
4️⃣ Our Raspberry Pi connects to PineTime via an open-source program called OpenOCD (Open On-Chip Debugger). OpenOCD controls the flashing and debugging of PineTime by communicating with the SWD (Serial Wire Debug) protocol. (Created by Arm)
Here we explore the details of the SWD protocol. And learn why we should use I2C or SPI interfaces whenever possible… Not Bit Banging with GPIO.
5️⃣ PineTime is one tiny part of the enormous Open Source Embedded Ecosystem, which includes other open-source projects like FreeRTOS, Zephyr OS, RIOT OS, Mynewt OS, TinyGo, Rust Embedded, …
Learn more about these open-source projects in the “References” section of this article…
6️⃣ And if you’re located in the East, I have a special urgent message for you…
7️⃣ PineTime Challenge: Bluetooth Mesh Programming
Bluetooth Mesh enables a local network of PineTime watches (and other gadgets) to communicate with one another, peer to peer.
Bluetooth Mesh has the potential to do so much good for humankind… Alert nearby swimmers if you’re downing… Fall detection for workers at Construction Worksites… Find lost children (and maybe pets)…
But programming Bluetooth Mesh is incredibly hard, check out this code in C. Can we make mesh coding easier for newbies?
8️⃣ Why did we select Rust and Mynewt? That’s explained here…
9️⃣ We are working on a solution to flash PineTime firmware via Bluetooth LE…
Rust is not resource hungry as we think! Building our Rust Firmware requires under 900 MB of RAM on Raspberry Pi 4. Includes VSCode.
What’s Next?
Chat with the PineTime Community and me (lupyuen#4063) on Discord!
The firmware debugging experience in this article is realistic even though we are running on hardware that’s a fraction of the cost of professional debugging hardware.
That’s possible because the PineTime debugger uses a modified version of OpenOCD that’s explained in the article “OpenOCD on Raspberry Pi: Better with SWD on SPI”
Thanks everyone for testing openocd-spi… PineTime Debugger wouldn’t have been possible without you! 😃
Based on the response from the PineTime Community on Discord, I’m exploring how we may drag and drop blocks to create PineTime programs visually…
Stay Tuned!
Visual Rust for PineTime? Stay Tuned!
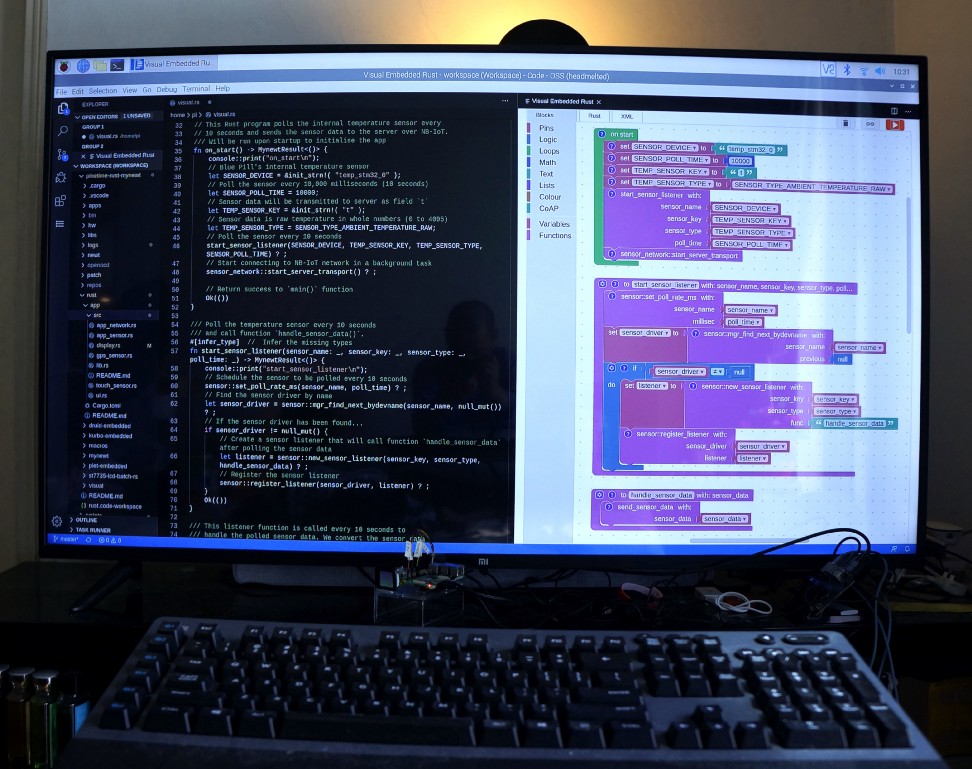
Visual Rust for PineTime? Stay Tuned!