📝 21 Oct 2021
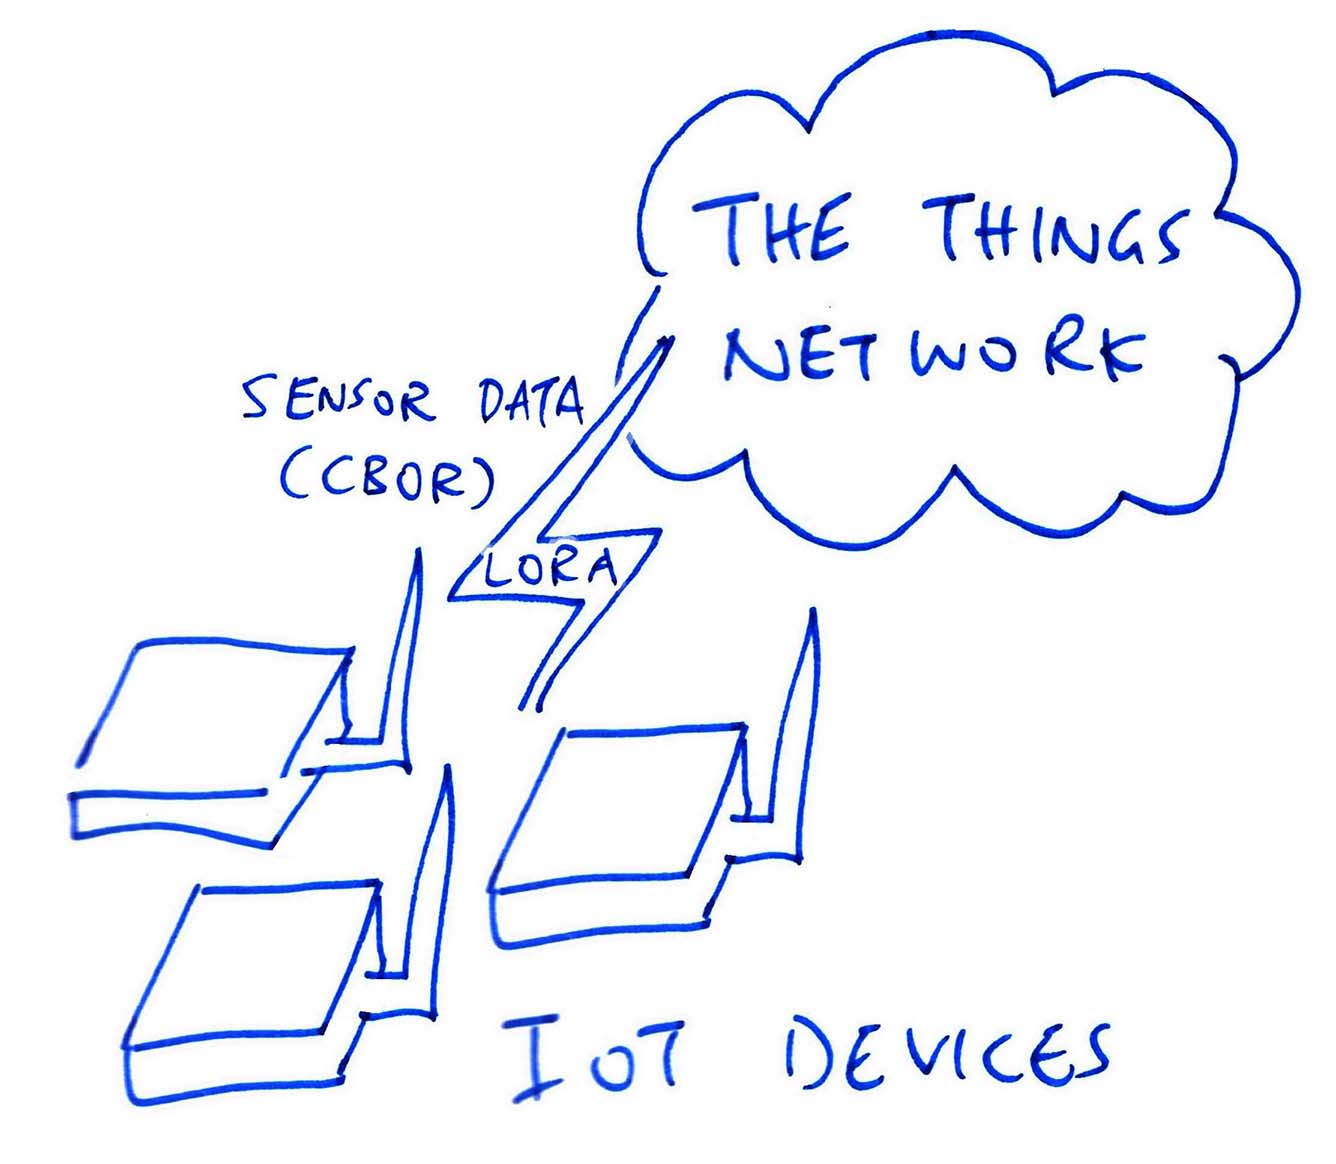
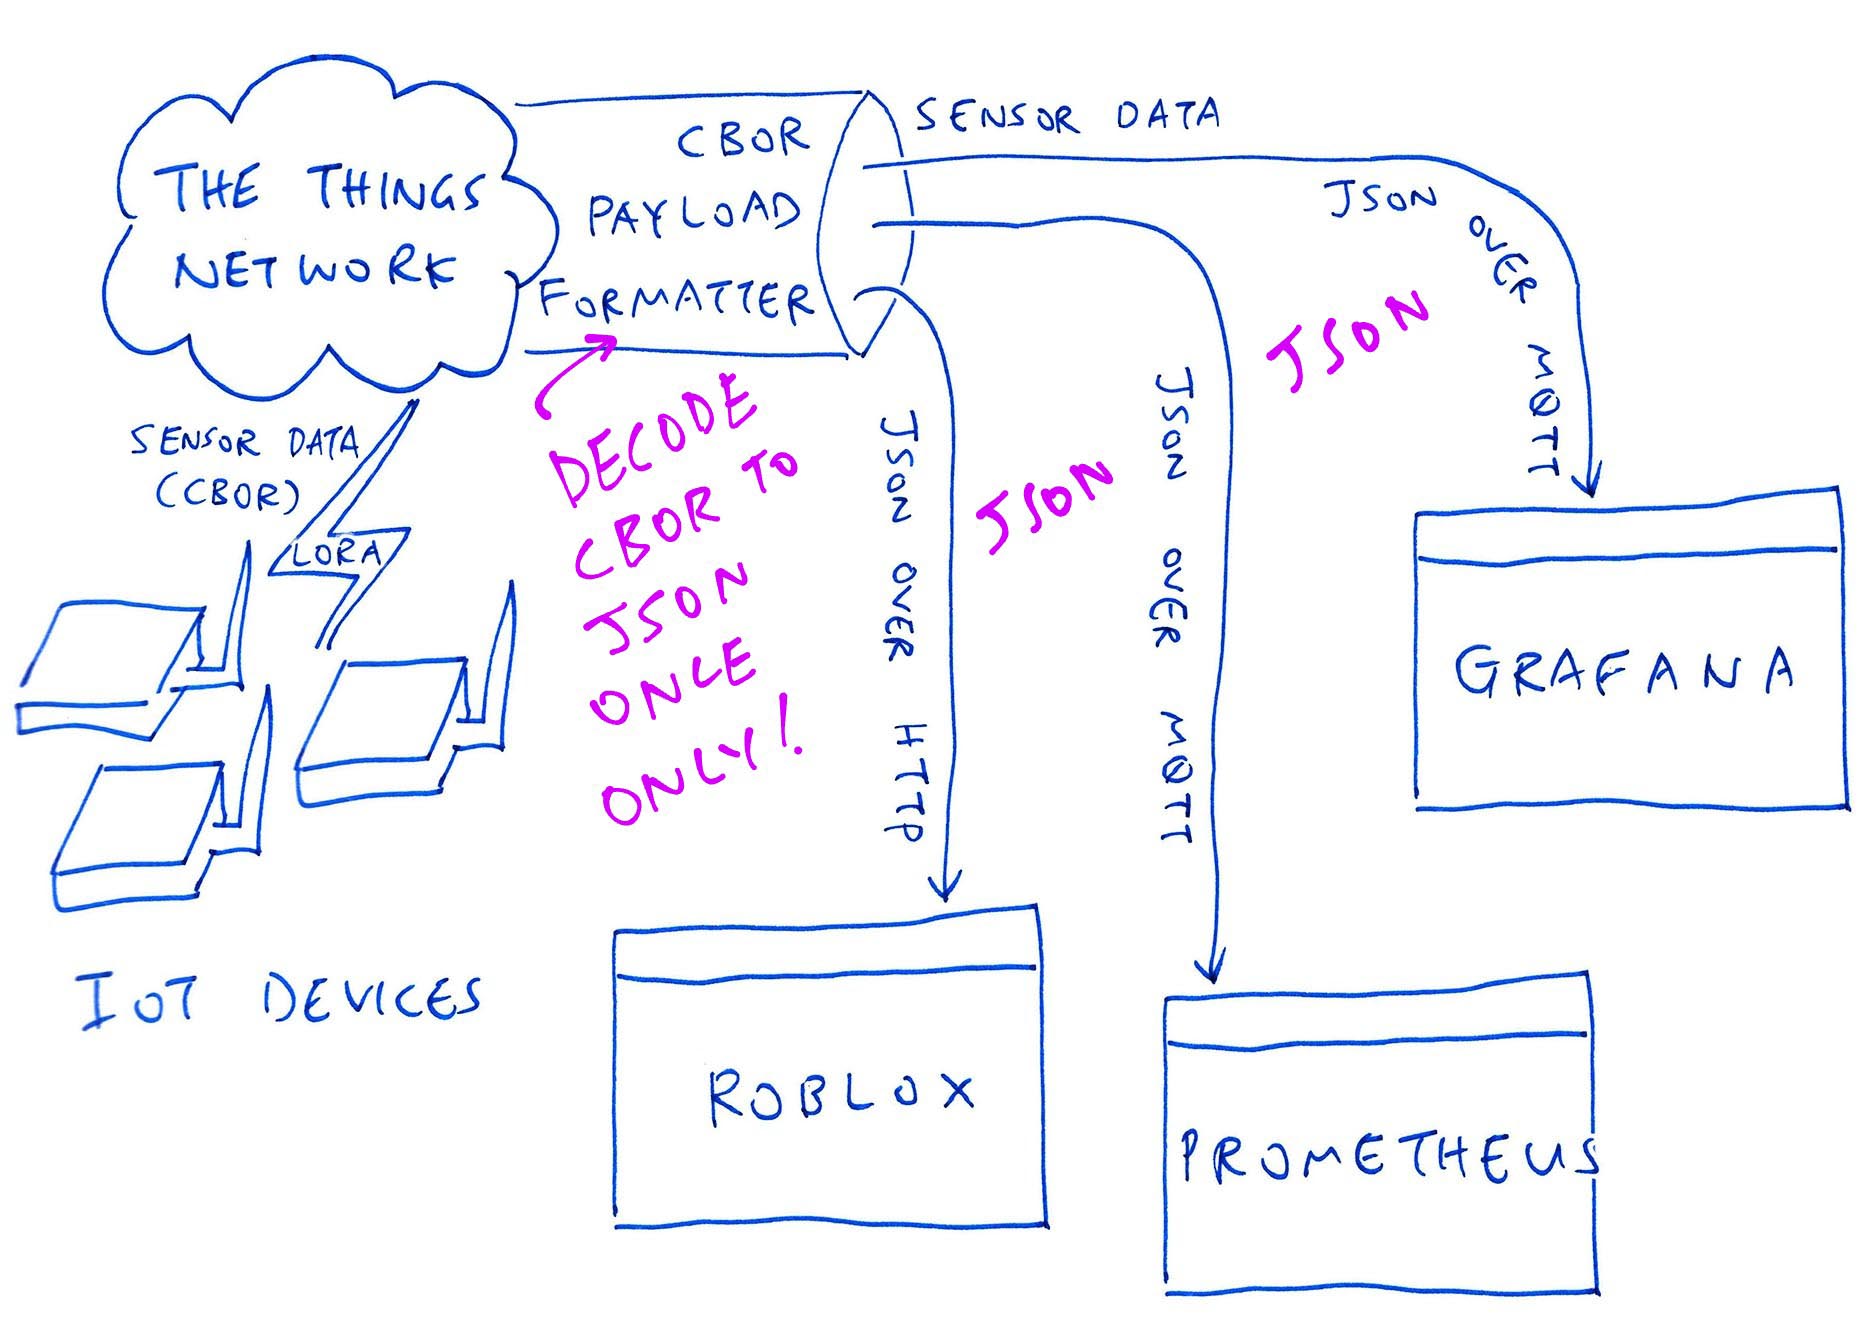
Suppose we have some IoT Devices that transmit Sensor Data (via LoRa and LoRaWAN) to The Things Network…
(That’s the free-to-use public global wireless network for IoT Devices)
How shall we monitor the Sensor Data transmitted by the IoT Devices?
Today we shall monitor IoT Sensor Data by connecting open source Prometheus and Grafana to The Things Network…
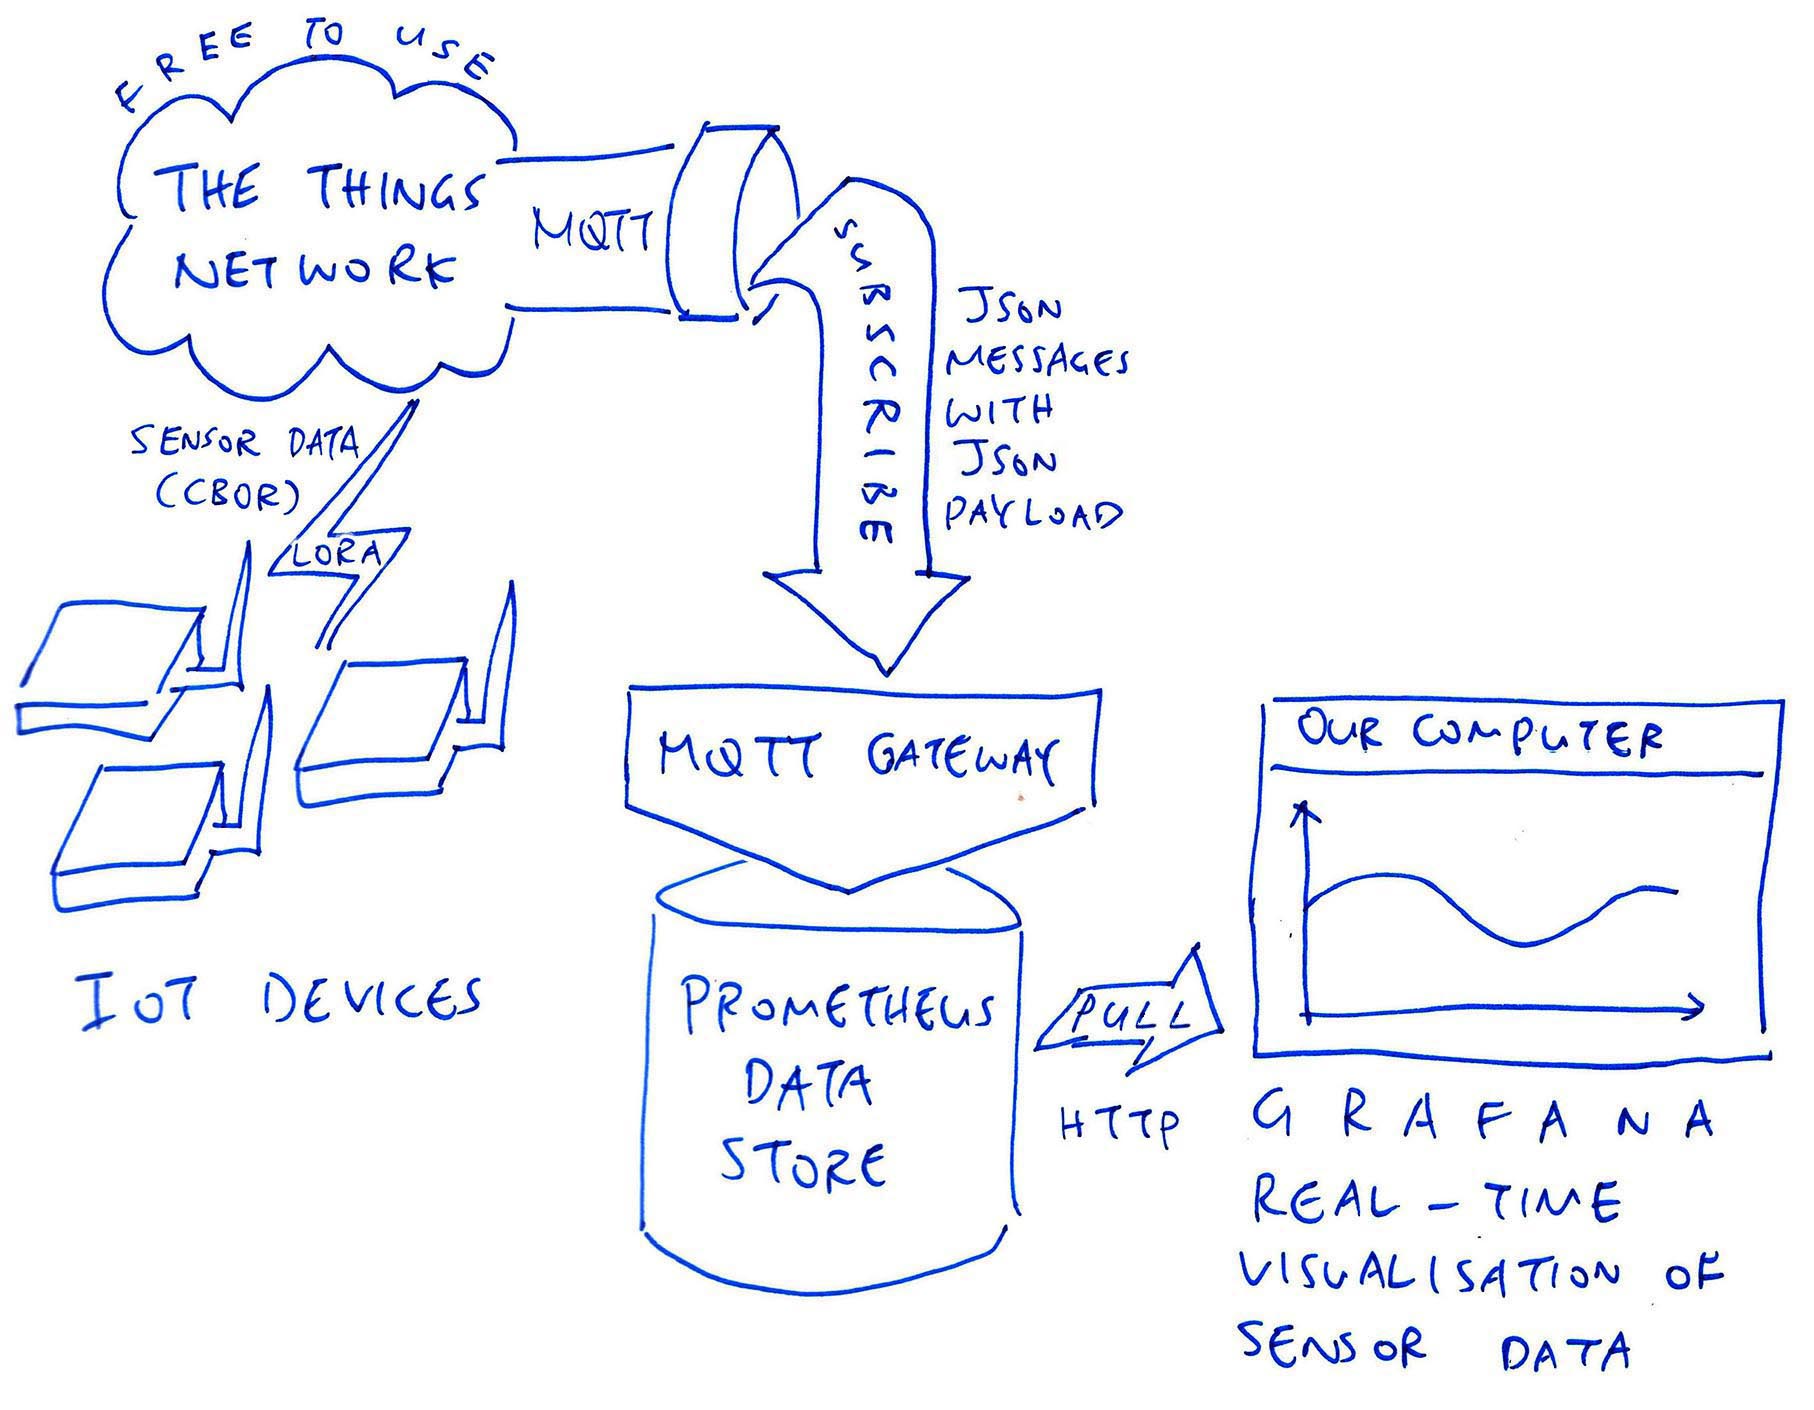
The Things Network pushes our Sensor Data over MQTT in real time
Our MQTT Gateway consumes the Sensor Data…
And publishes the Sensor Data to our Prometheus Time Series Database…
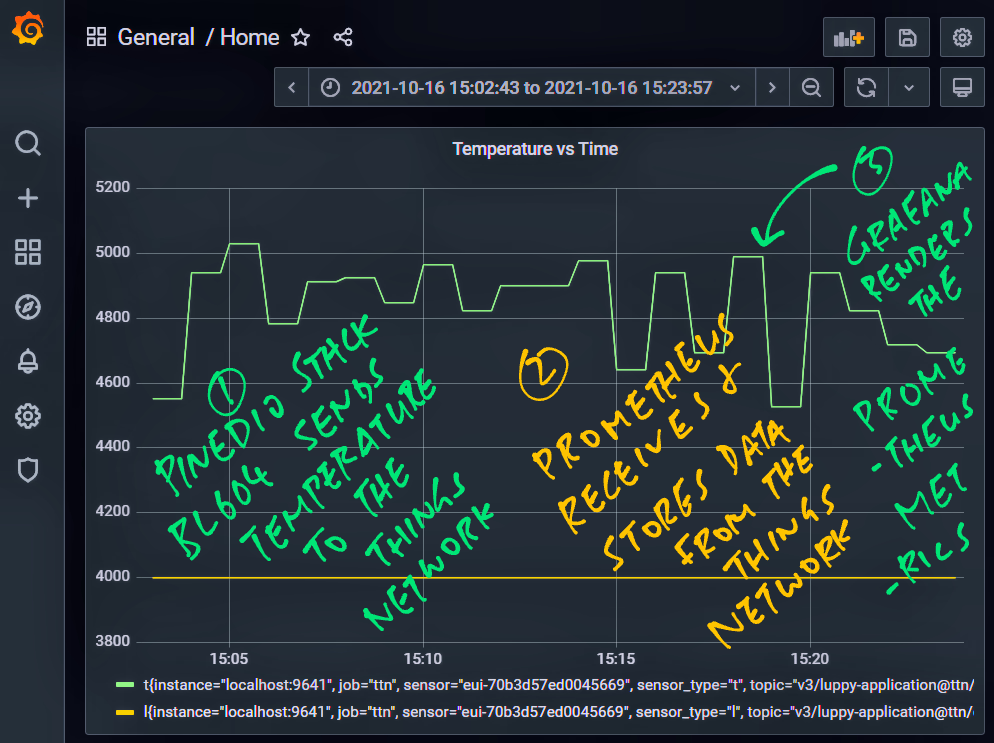
Which gets rendered as a Grafana Dashboard like this…
Why Prometheus and Grafana?
Prometheus works great for storing and querying IoT Sensor Data.
And Grafana works well with Prometheus for visualising IoT Sensor Data.
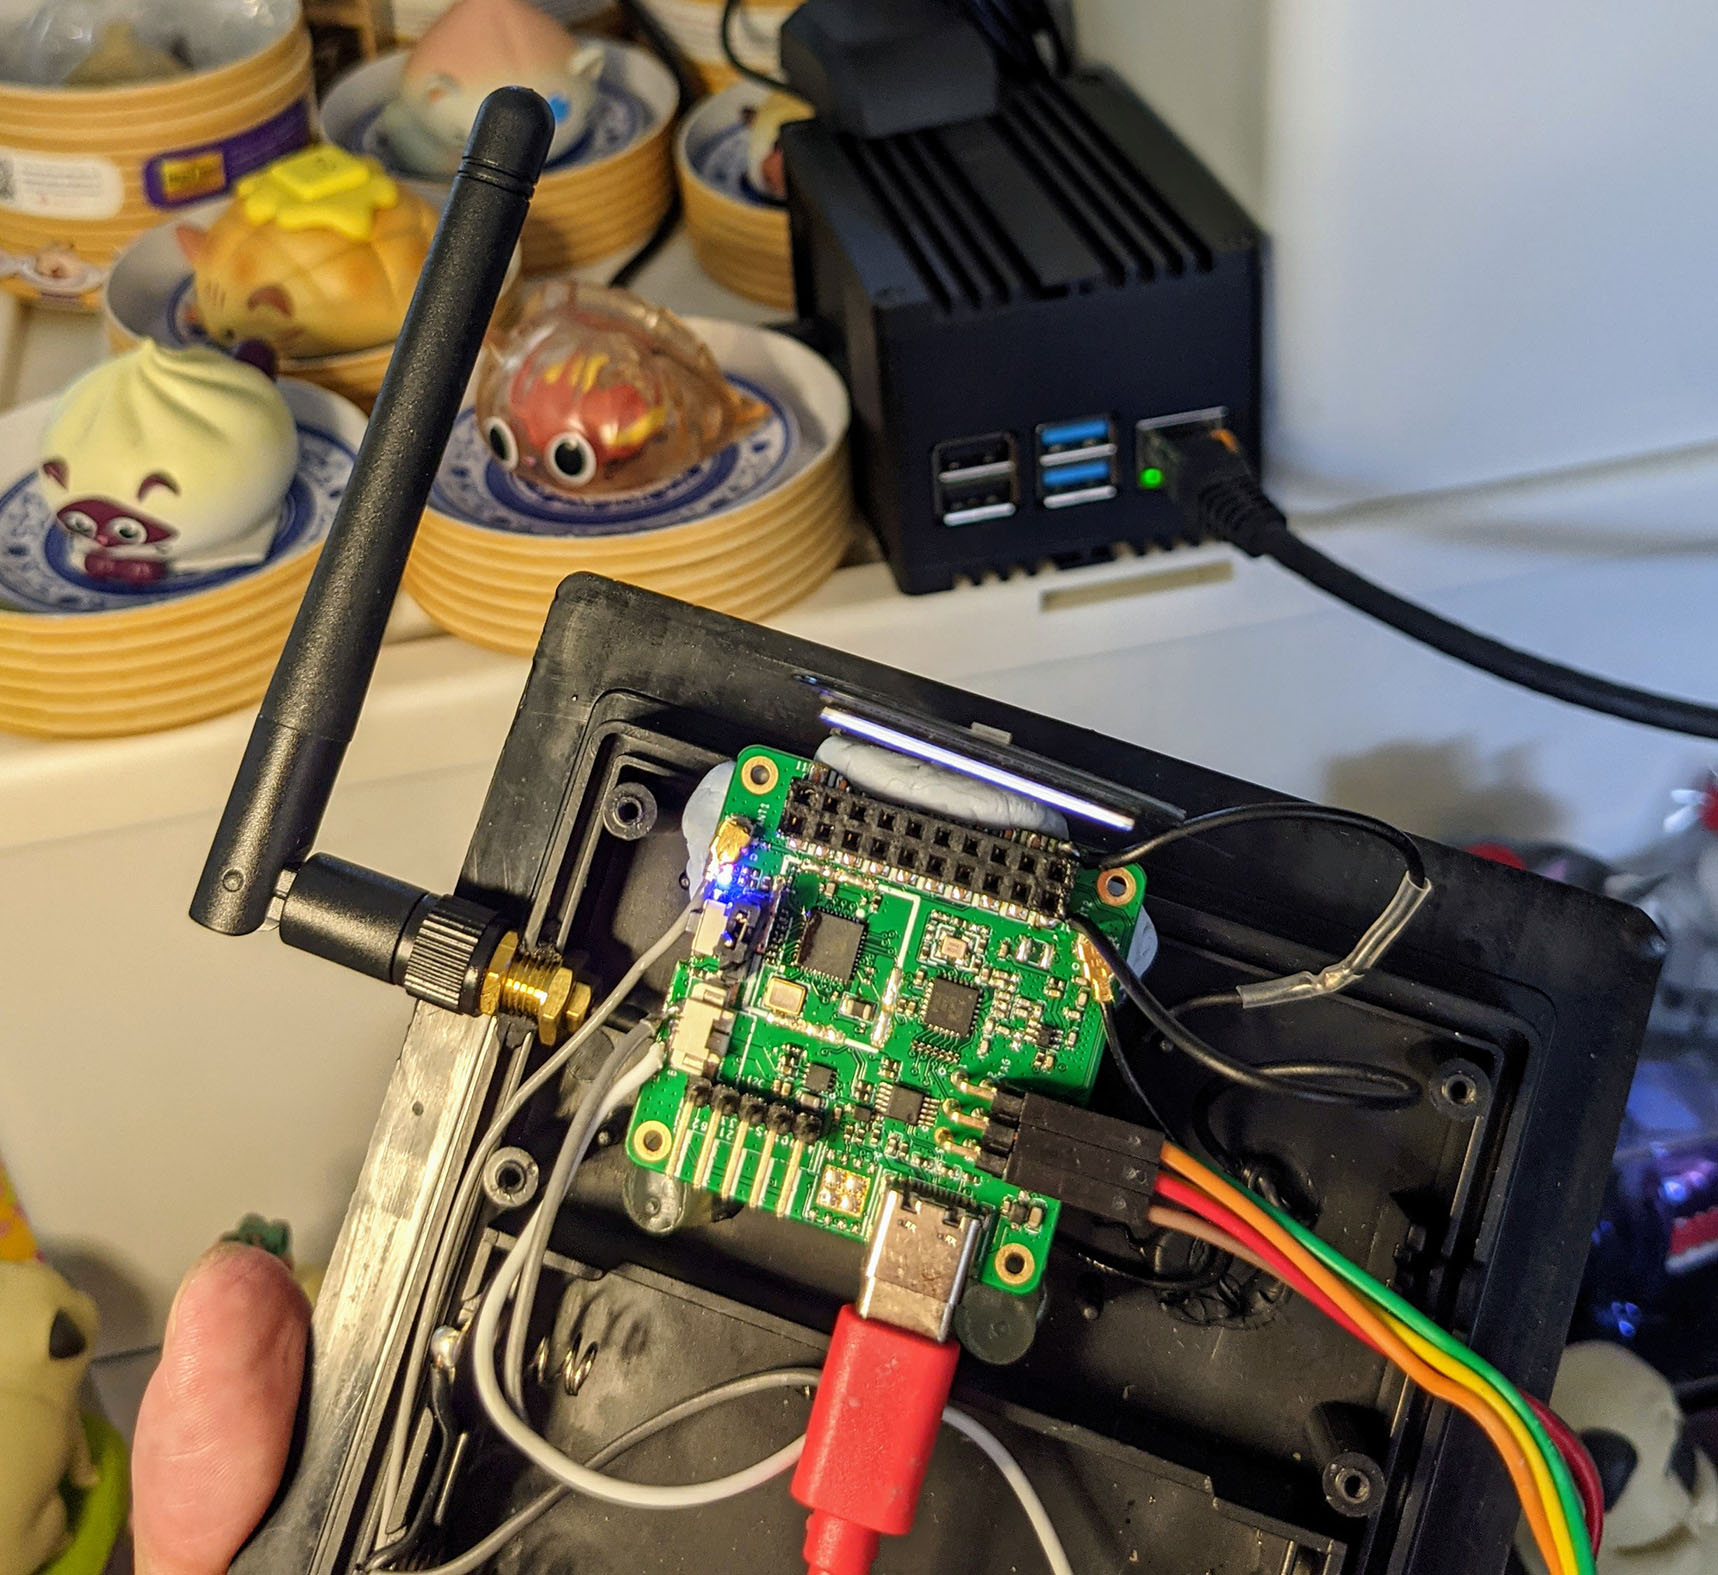
In a while we shall demo this Prometheus + Grafana Setup with PineDio Stack BL604 RISC-V Board (pic above)
But it should work for any LoRaWAN Device connected to The Things Network… Assuming that we have configured a suitable Payload Formatter in The Things Network.
(Read on to learn how)
What’s a Payload Formatter in The Things Network?
A Payload Formatter is JavaScript Code that we configure in The Things Network to decode the Sensor Data in the LoRaWAN Message Payload.
For PineDio Stack our Sensor Data is encoded with CBOR (Concise Binary Object Representation), so we use this CBOR Payload Formatter…
Is it mandatory to use a Payload Formatter?
Yes, our MQTT Gateway will work only if we configure a suitable Payload Formatter that will decode our Sensor Data.
(More about Payload Formatters)
What if we can’t find a suitable Payload Formatter?
We can make one together! Post a comment here
Let’s verify that our Payload Formatter works OK for decoding our Sensor Data…
Start the LoRaWAN Firmware on our LoRaWAN Device (PineDio Stack).
Transmit some Sensor Data every minute…
Log on to The Things Network Console
Click Applications → (Your Application) → Live Data
Our Decoded Sensor Data should appear in the Live Data Table like so…
Payload: { l: 4000, t: 4669 }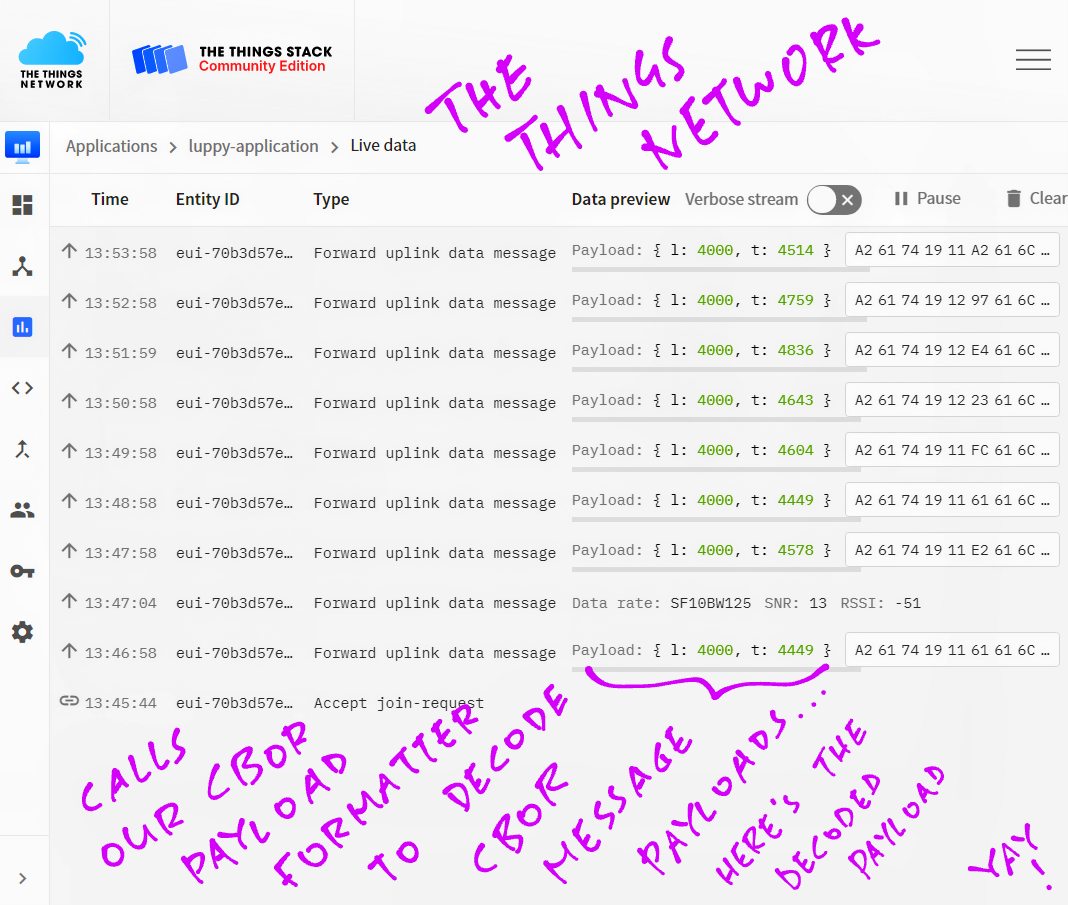
Click on a message in the Live Data Table.
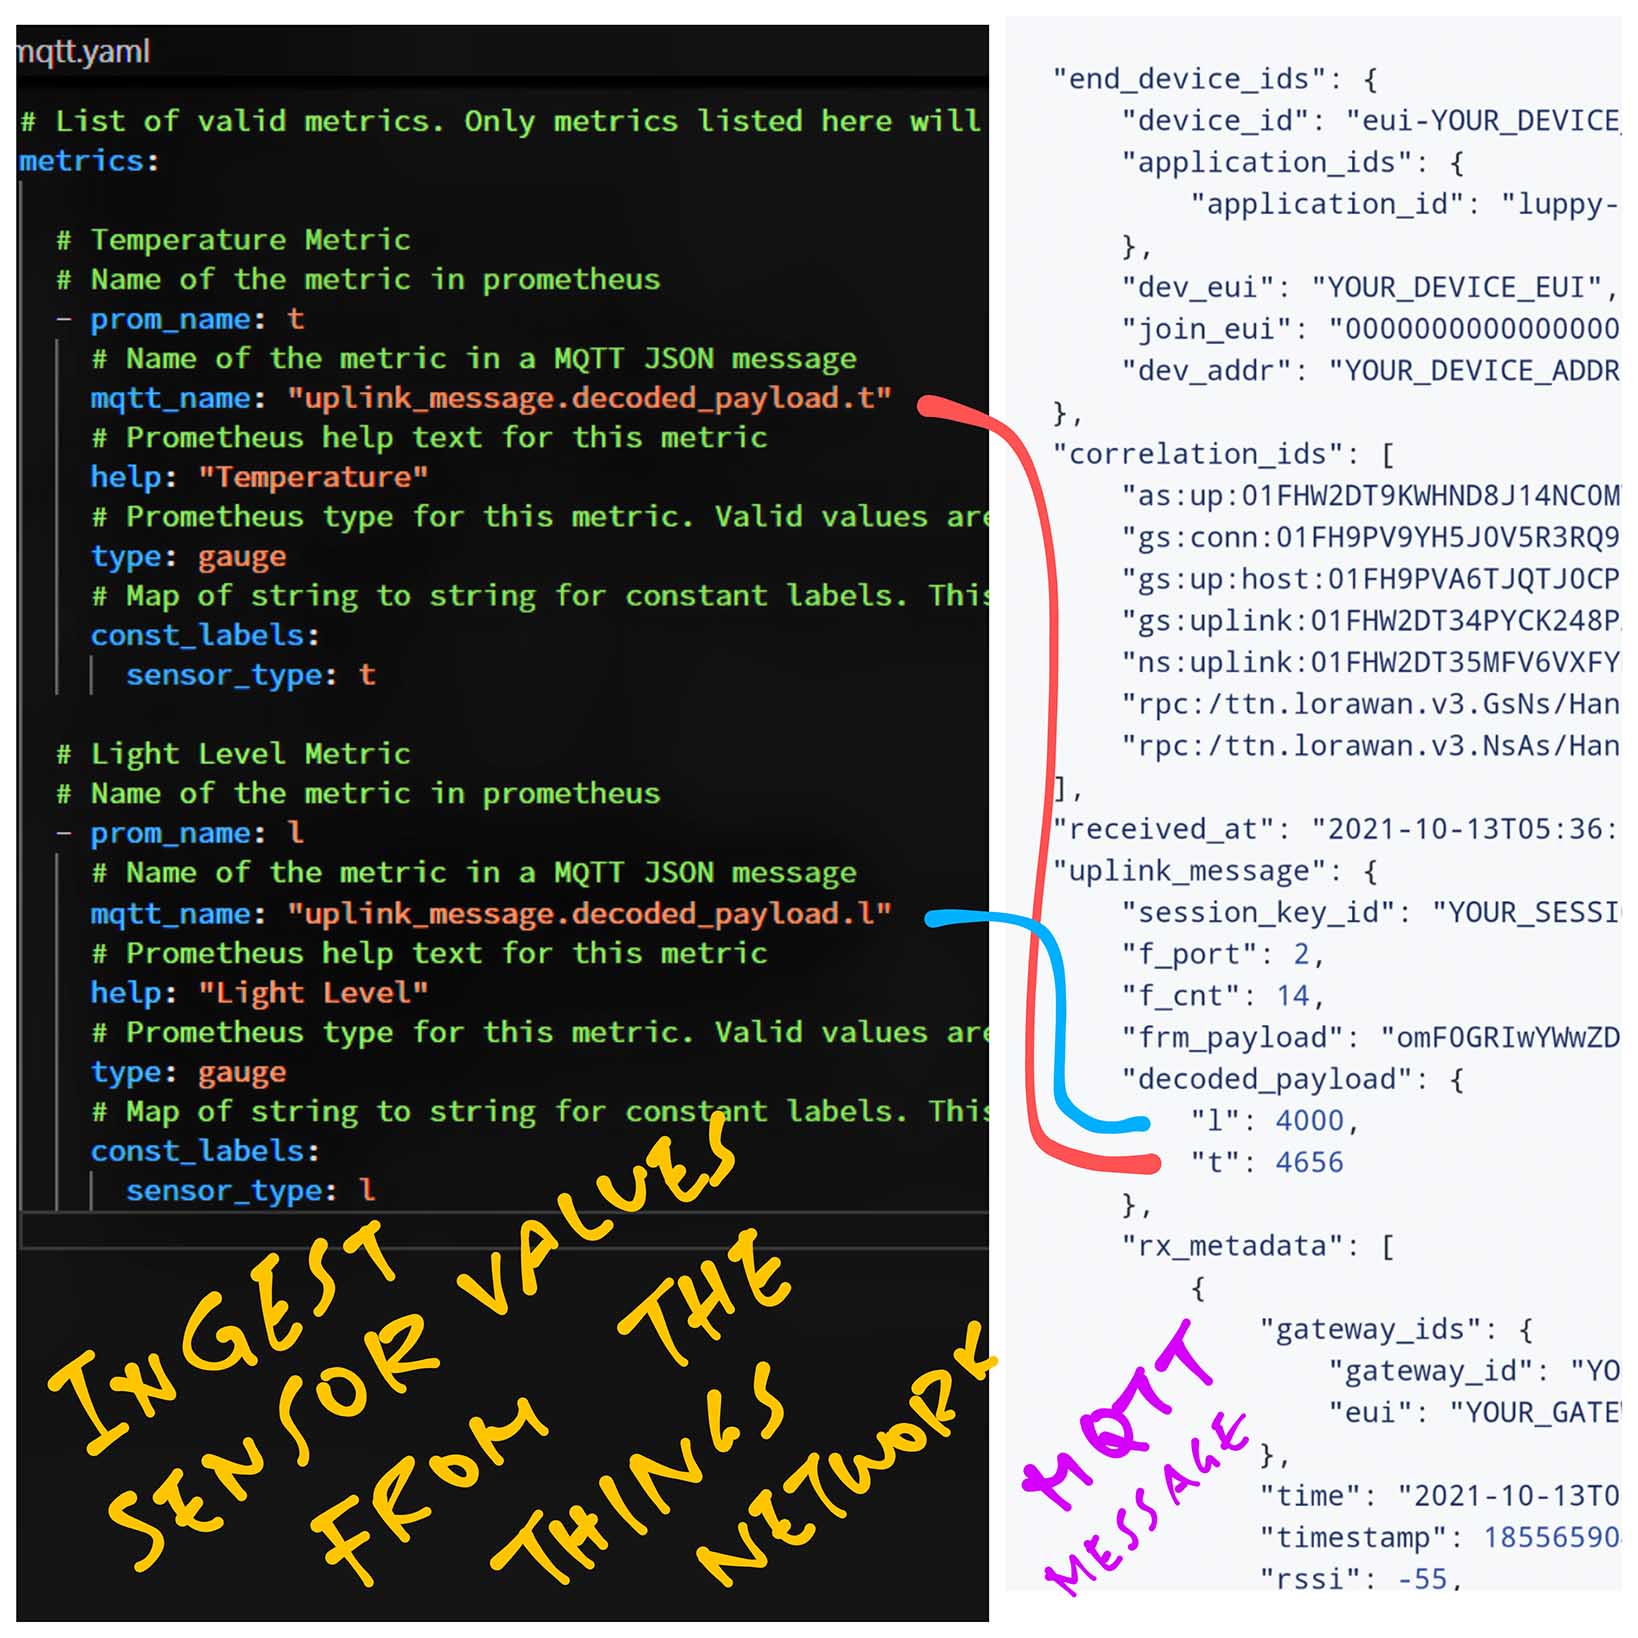
We should see the decoded_payload field containing our Decoded Sensor Data…
{
  ...
  "uplink_message": {
    ...
    "decoded_payload": {
      "l": 4000,
      "t": 4656
    }
These are the Light Sensor (“l”) and Temperature Sensor (“t”) values transmitted by our LoRaWAN Device (PineDio Stack).
(Our Temperature Values are scaled up 100 times… 4656 means 46.56 ºC)
Also verify that the MQTT Server works OK at The Things Network…
Start our LoRaWAN Firmware and transmit Sensor Data every minute
Copy the MQTT Public Address, Username and Password from The Things Network…
Install the command-line tools for MQTT…
Enter this at the command line…
## Change au1.cloud.thethings.network to our
## MQTT Public Address (without the port number)
## Change YOUR_USERNAME to our MQTT Username
## Change YOUR_PASSWORD to our MQTT Password

## For Linux and macOS:
mosquitto_sub \
  -h au1.cloud.thethings.network \
  -t "#" \
  -u "YOUR_USERNAME" \
  -P "YOUR_PASSWORD" \
  -d

## For Windows:
"c:\Program Files\Mosquitto\mosquitto_sub" ^
  -h au1.cloud.thethings.network ^
  -t "#" ^
  -u "YOUR_USERNAME" ^
  -P "YOUR_PASSWORD" ^
  -d
We should see the Uplink Messages transmitted by our LoRaWAN Device…
{
  ...
  "uplink_message": {
    ...
    "decoded_payload": {
      "l": 4000,
      "t": 4656
    }
Including decoded_payload and the Decoded Sensor Data.
Now we connect our MQTT Gateway to The Things Network…
Our MQTT Gateway shall…
Subscribe to all MQTT Topics published on The Things Network
(Including the Uplink Messages transmitted by our device)
Ingest the Decoded Sensor Data from the Uplink Messages
(As Prometheus Metrics)
Follow these steps to configure our MQTT Gateway…
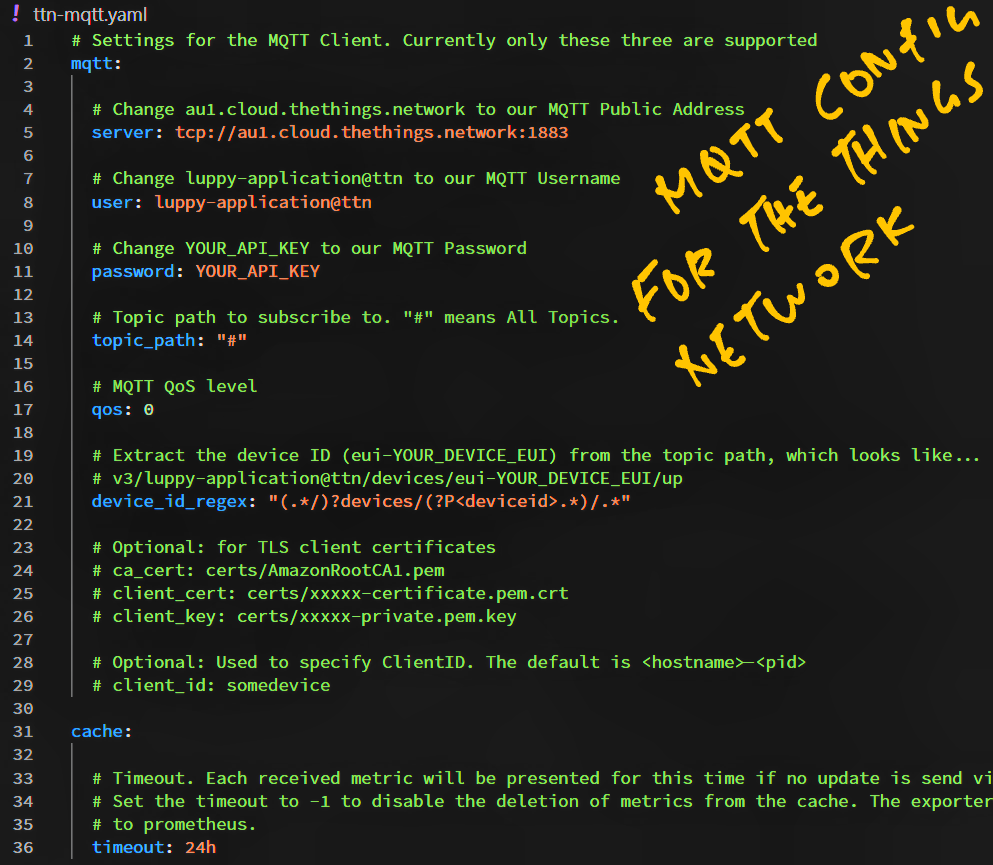
Download the MQTT Gateway Configuration File…
Edit the file. Fill in the MQTT Public Address, Username and Password for The Things Network (from here)…
## Change au1.cloud.thethings.network to our MQTT Public Address
server: tcp://au1.cloud.thethings.network:1883

## Change luppy-application@ttn to our MQTT Username
user: luppy-application@ttn

## Change YOUR_API_KEY to our MQTT Password
password: YOUR_API_KEY
Note that we’re subscribing to all MQTT Topics…
## Topic path to subscribe to. "#" means All Topics.
topic_path: "#"
Our MQTT Gateway shall extract the Device ID from the MQTT Topic Path…
## Extract the device ID (eui-YOUR_DEVICE_EUI)
## from the topic path, which looks like...
## v3/luppy-application@ttn/devices/eui-YOUR_DEVICE_EUI/up
device_id_regex: "(.*/)?devices/(?P<deviceid>.*)/.*"
(Which will be helpful for filtering our Sensor Data by Device ID in Grafana)
What’s a Prometheus Metric?
A Metric is an item of Monitoring Data that’s collected and reported by Prometheus.
(Think of Metrics like CPU Usage and RAM Utilisation… Prometheus was originally created for monitoring servers)
In this article we shall use “Sensor Data” and “Metric” interchangeably, since Prometheus treats our Sensor Data as Metrics.
Let’s define the Sensor Data / Metrics that will be ingested by our MQTT Gateway…
Edit ttn-mqtt.yaml
Look for the metrics section…
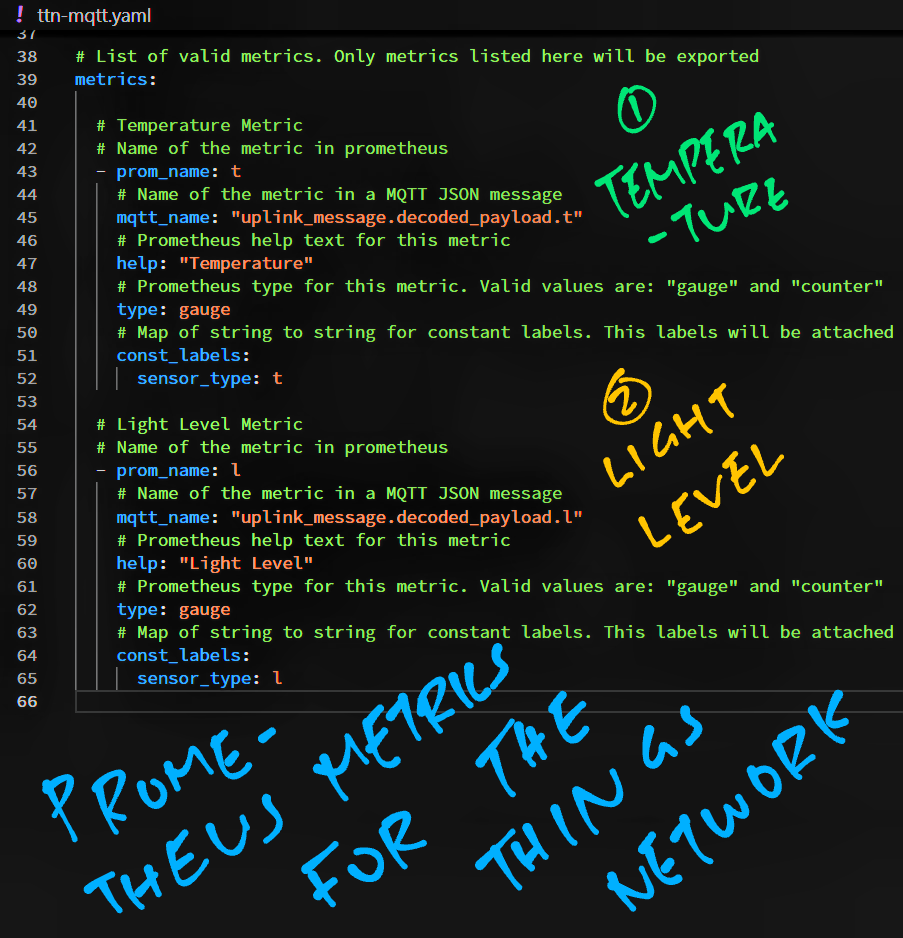
We define the Metric for Temperature like so…
## Temperature Metric
## Name of the metric in prometheus
- prom_name: t

  ## JSON Path of the metric in our MQTT JSON message
  mqtt_name: "uplink_message.decoded_payload.t"

  ## Prometheus help text for this metric
  help: "Temperature"

  ## Prometheus type for this metric.
  ## Valid values are: "gauge" and "counter"
  type: gauge

  ## Map of string to string for constant labels.
  ## The labels will be attached to every Prometheus metric.
  const_labels:
    sensor_type: t
This tells MQTT Gateway: Our LoRaWAN Device (PineDio Stack) transmits a Temperature Value (named “t”) at this JSON Path…
uplink_message.decoded_payload.tWhich matches our JSON Message Format from Checkpoint Alpha…
{
  ...
  "uplink_message": {
    ...
    "decoded_payload": {
      "l": 4000,
      "t": 4656
    }
(Our Temperature Values are scaled up 100 times… 4656 means 46.56 ºC)
We define other Metrics the same way, like this Light Level Metric that’s transmitted by PineDio Stack…
## Light Level Metric
## Name of the metric in prometheus
- prom_name: l

  ## JSON Path of the metric in our MQTT JSON message
  mqtt_name: "uplink_message.decoded_payload.l"

  ## Prometheus help text for this metric
  help: "Light Level"

  ## Prometheus type for this metric.
  ## Valid values are: "gauge" and "counter"
  type: gauge

  ## Map of string to string for constant labels.
  ## The labels will be attached to every Prometheus metric.
  const_labels:
sensor_type: lWe’re ready to start our MQTT Gateway!
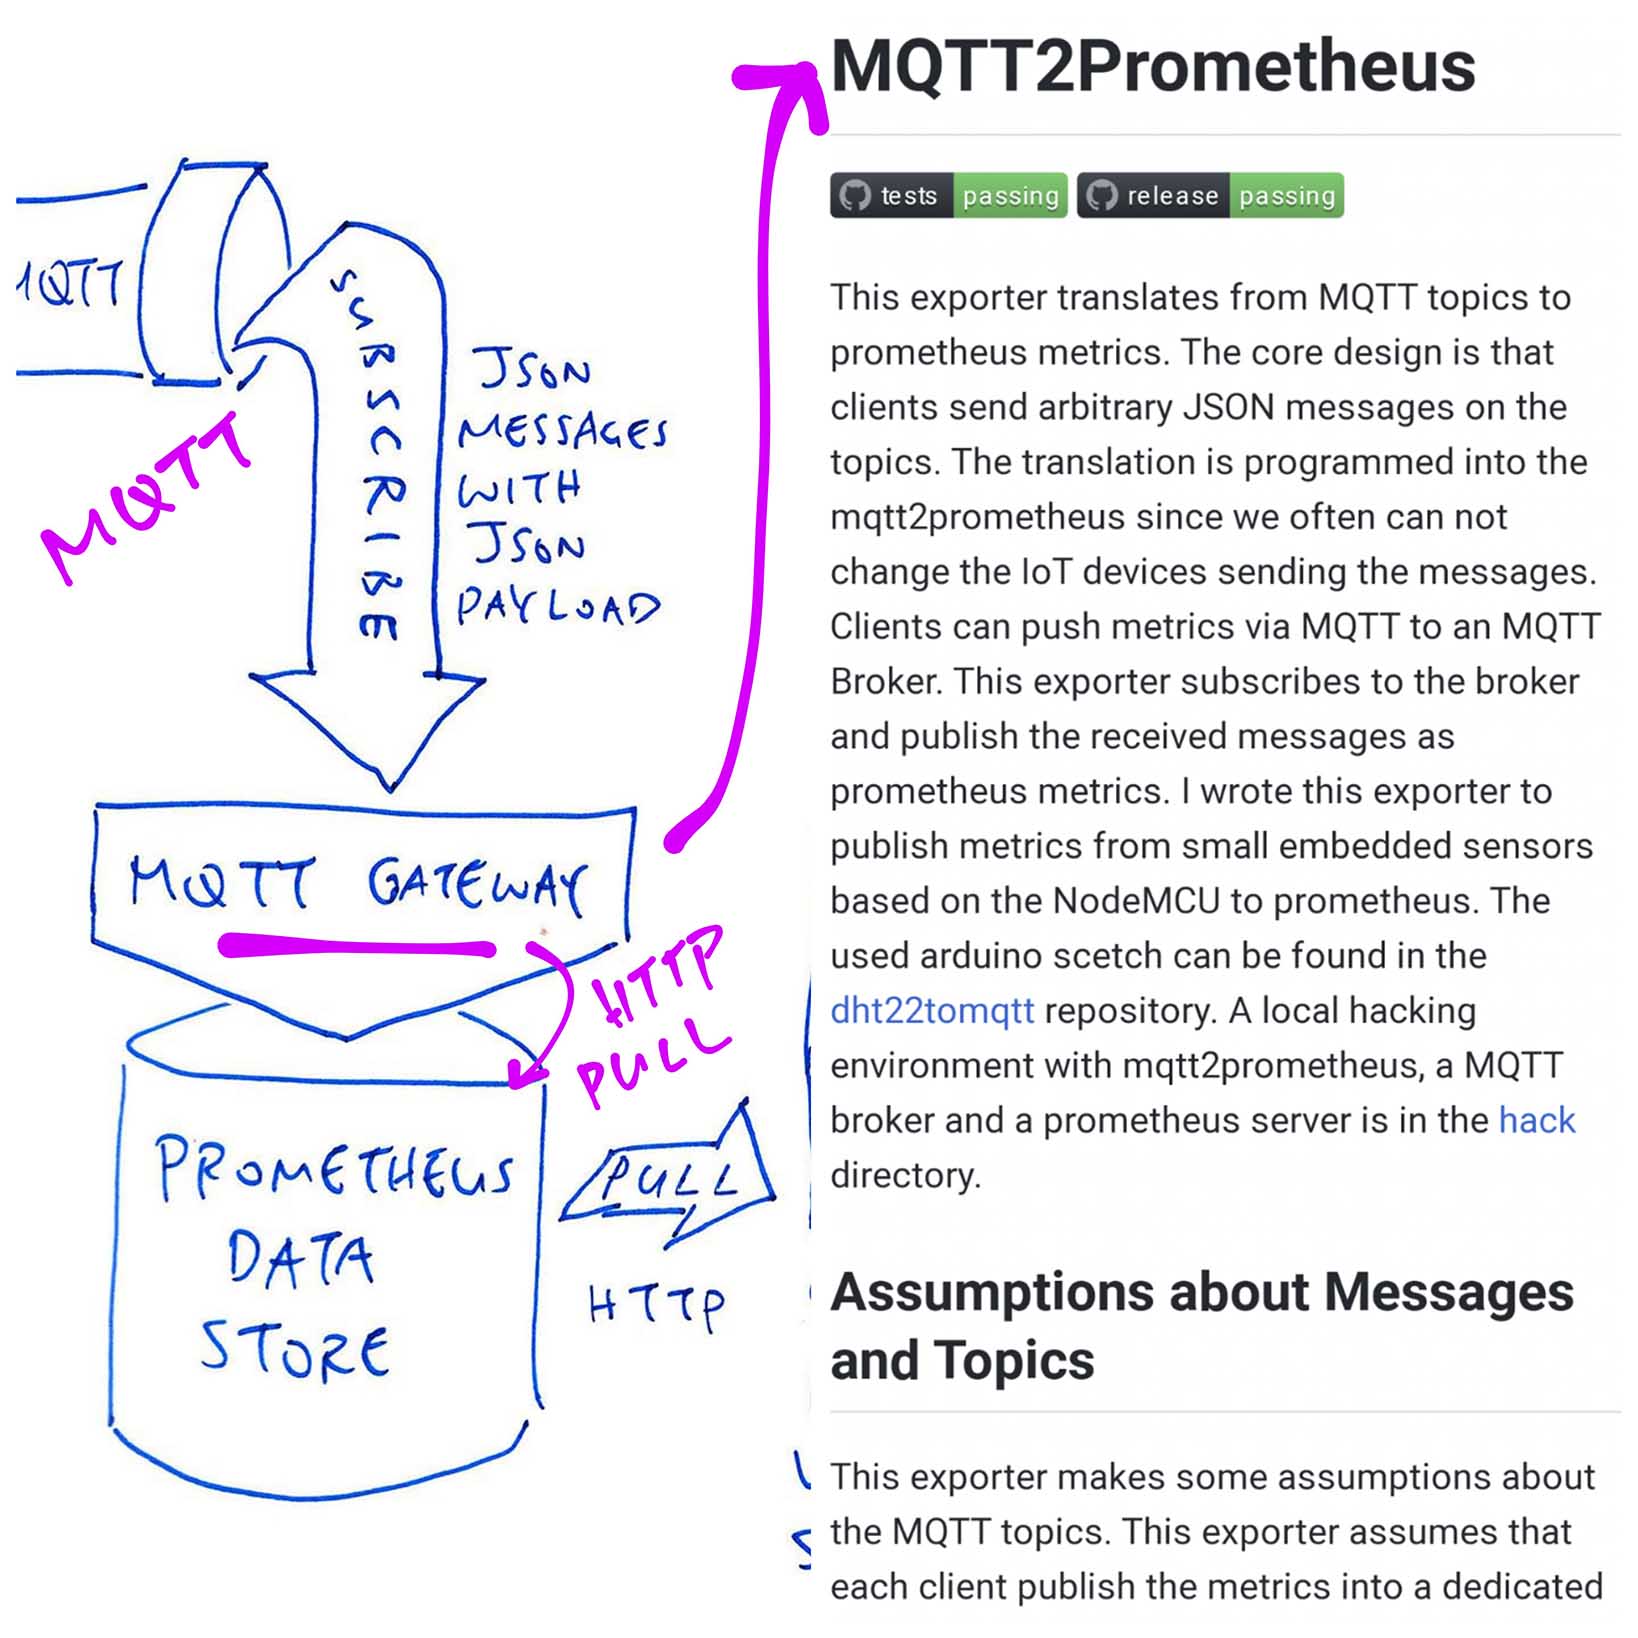
Follow these steps to download and run MQTT2Prometheus…
Install the latest version of Go…
Enter this at the command line…
## Download mqtt2prometheus
go get github.com/hikhvar/mqtt2prometheus

## For Linux and macOS:
cd $GOPATH/src/github.com/hikhvar/mqtt2prometheus

## For Windows:
cd %GOPATH%\src\github.com\hikhvar\mqtt2prometheus

## Build mqtt2prometheus
go build ./cmd

## Run mqtt2prometheus.
## Change "ttn-mqtt.yaml" to the full path of our
## MQTT Gateway Configuration File.
go run ./cmd -log-level debug -config ttn-mqtt.yaml
For Windows: Click “Private Network: Allow Access” when prompted
(That’s because our MQTT Gateway starts a HTTP Server at port 9641)
We should see our MQTT Gateway ingesting Sensor Data from The Things Network…
mqttclient/mqttClient.go:20
Connected to MQTT Broker

mqttclient/mqttClient.go:21
Will subscribe to topic "#"

web/tls_config.go:191
"TLS is disabled.", "http2": false

metrics/ingest.go:42
Got message
"topic": "v3/luppy-application@ttn/devices/eui-YOUR_DEVICE_EUI/up", "payload":
{
  ...
  "uplink_message": {
    "decoded_payload": {
      "l": 4000,
      "t": 5017
    }
MQTT Gateway is now listening for HTTP Requests at port 9641!
Let’s check the Sensor Data ingested by our MQTT Gateway…
Start our LoRaWAN Firmware and transmit Sensor Data every minute
Enter this at the command-line…
curl -v http://localhost:9641/metricsWe should see our Sensor Data (Temperature and Light Level) ingested as Prometheus Metrics…
## HELP l Light Level
## TYPE l gauge
l{sensor="eui-YOUR_DEVICE_EUI",
sensor_type="l",
topic="v3/luppy-application@ttn/devices/eui-YOUR_DEVICE_EUI/up"
} 4000 1634364863274
...

## HELP t Temperature
## TYPE t gauge
t{sensor="eui-YOUR_DEVICE_EUI",
sensor_type="t",
topic="v3/luppy-application@ttn/devices/eui-YOUR_DEVICE_EUI/up"
} 5056 1634364863274
This says that the Light Level is 4000 and the Temperature is 50.56 ºC, recorded at the Timestamp of 1634364863274.
Also watch for received_messages…
## HELP received_messages received messages per topic and status
## TYPE received_messages counter
received_messages{status="success",
topic="v3/luppy-application@ttn/devices/eui-YOUR_DEVICE_EUI/up"
} 3
This says that our MQTT Gateway has successfully processed 3 messages from The Things Network.
Let’s move on to Prometheus…
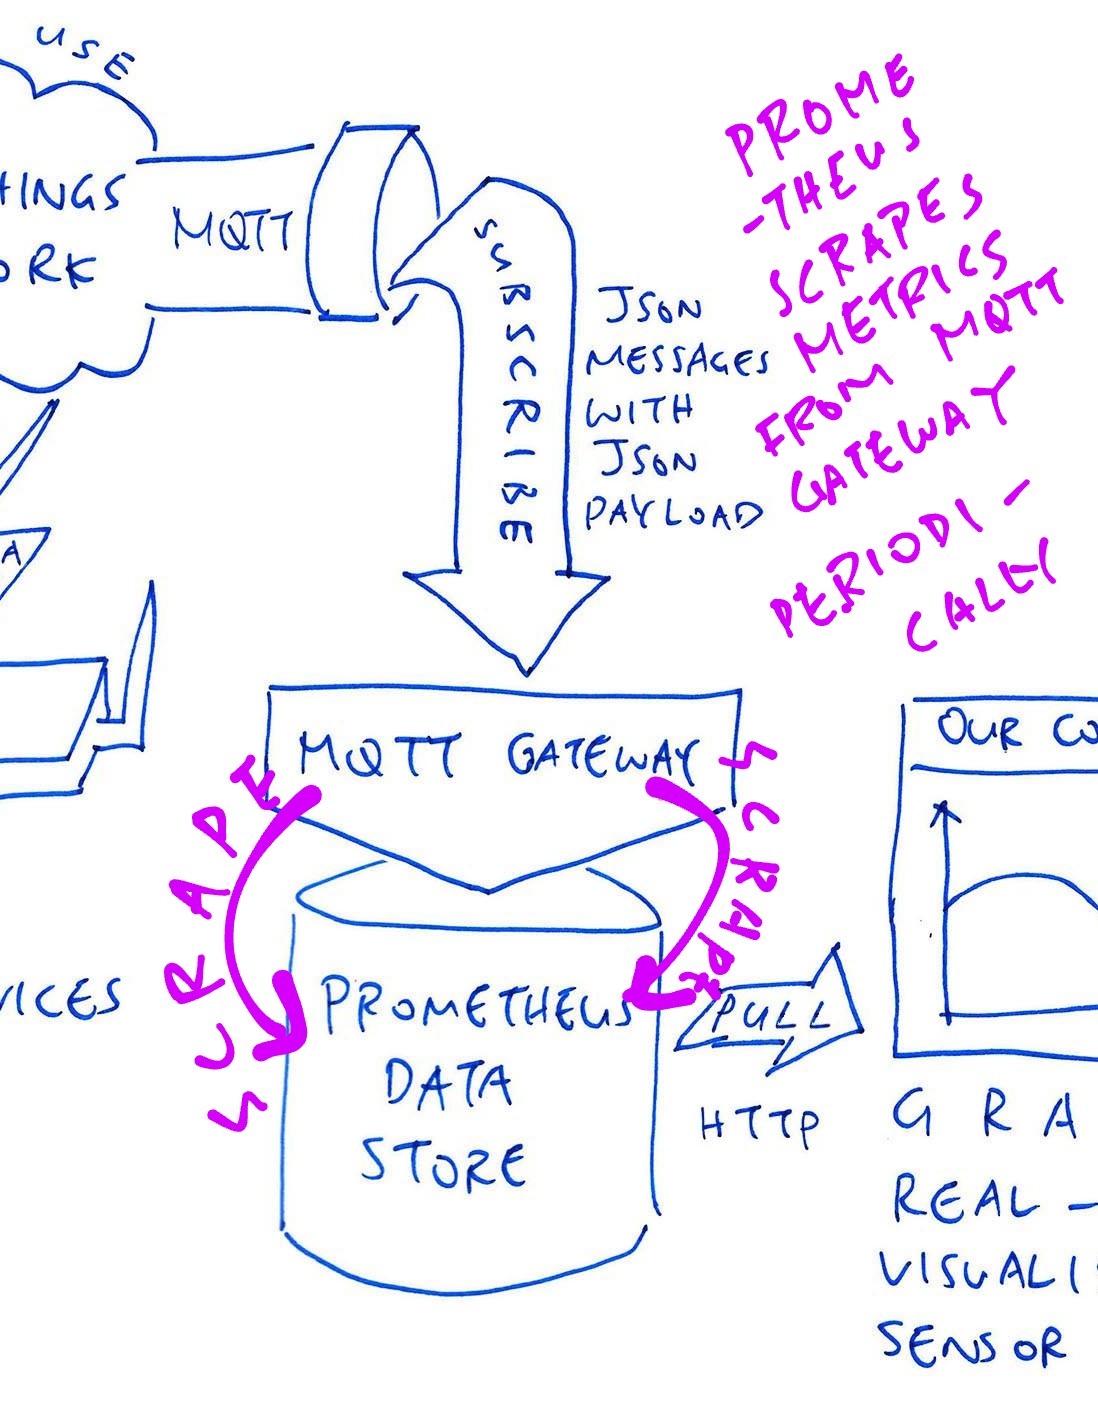
How do we push the Sensor Data / Metrics from MQTT Gateway to Prometheus?
Prometheus collects Metrics by scraping them over HTTP…
(Much like the curl command from Checkpoint Bravo)
And stores the Metrics in its Time Series Database.
(Which is super efficient for querying sensor values that vary over time)
Let’s configure and start Prometheus to scrape the Metrics from our MQTT Gateway…
Download and unzip Prometheus…
In the unzipped folder, edit the Prometheus Configuration File…
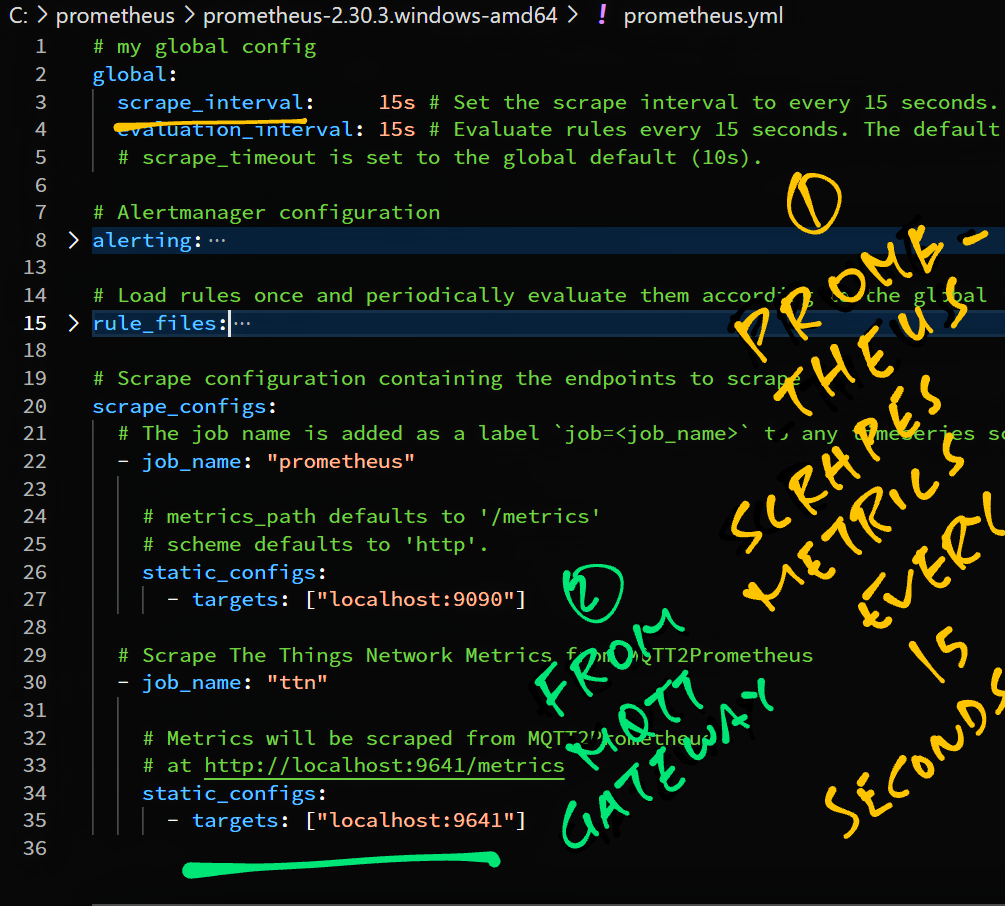
Under the scrape_configs section, add the following…
## Scrape configuration containing the endpoints to scrape
scrape_configs:
...

  ## Scrape The Things Network Metrics from MQTT2Prometheus
  - job_name: "ttn"

    ## Metrics will be scraped from MQTT2Prometheus
    ## at http://localhost:9641/metrics
    static_configs:
      - targets: ["localhost:9641"]
Note that Prometheus will scrape the Metrics from MQTT Gateway every 15 seconds…
## Global Configuration
global:

  ## Set the scrape interval to every 15 seconds
  scrape_interval: 15s
Start the Prometheus Server…
## Change this to the unzipped path of Prometheus
cd prometheus

## For Linux and macOS:
./prometheus

## For Windows:
prometheus.exe
We should see…
main.go:400
"No time or size retention was set so using the default time retention" duration=15d

main.go:438
"Starting Prometheus" version="(version=2.30.3, branch=HEAD, revision=f29caccc42557f6a8ec30ea9b3c8c089391bd5df)"

web.go:541
"Start listening for connections" address=0.0.0.0:9090

main.go:852
"TSDB started"

main.go:794
"Server is ready to receive web requests."
Prometheus is now listening for HTTP Requests at port 9090!
Let’s check the Metrics scraped by Prometheus from MQTT Gateway…
Start our LoRaWAN Firmware and transmit Sensor Data every minute
Browse to our Prometheus Server…
http://localhost:9090Enter the name of our Metric (like for Temperature)…
tLike this…
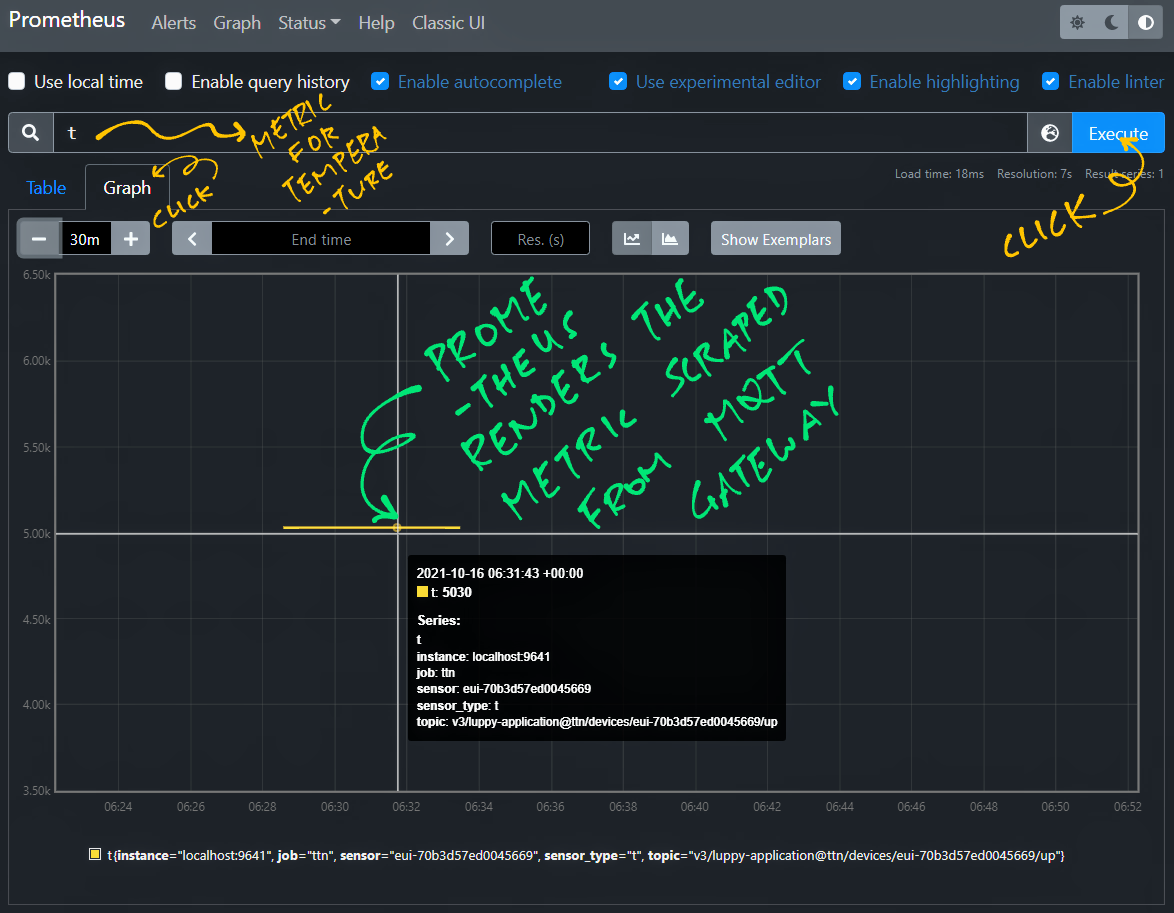
Click “Execute” and “Graph”
Our Metric appears in the graph.
(See pic above)
We’re ready for our final step… Connecting Prometheus to Grafana!
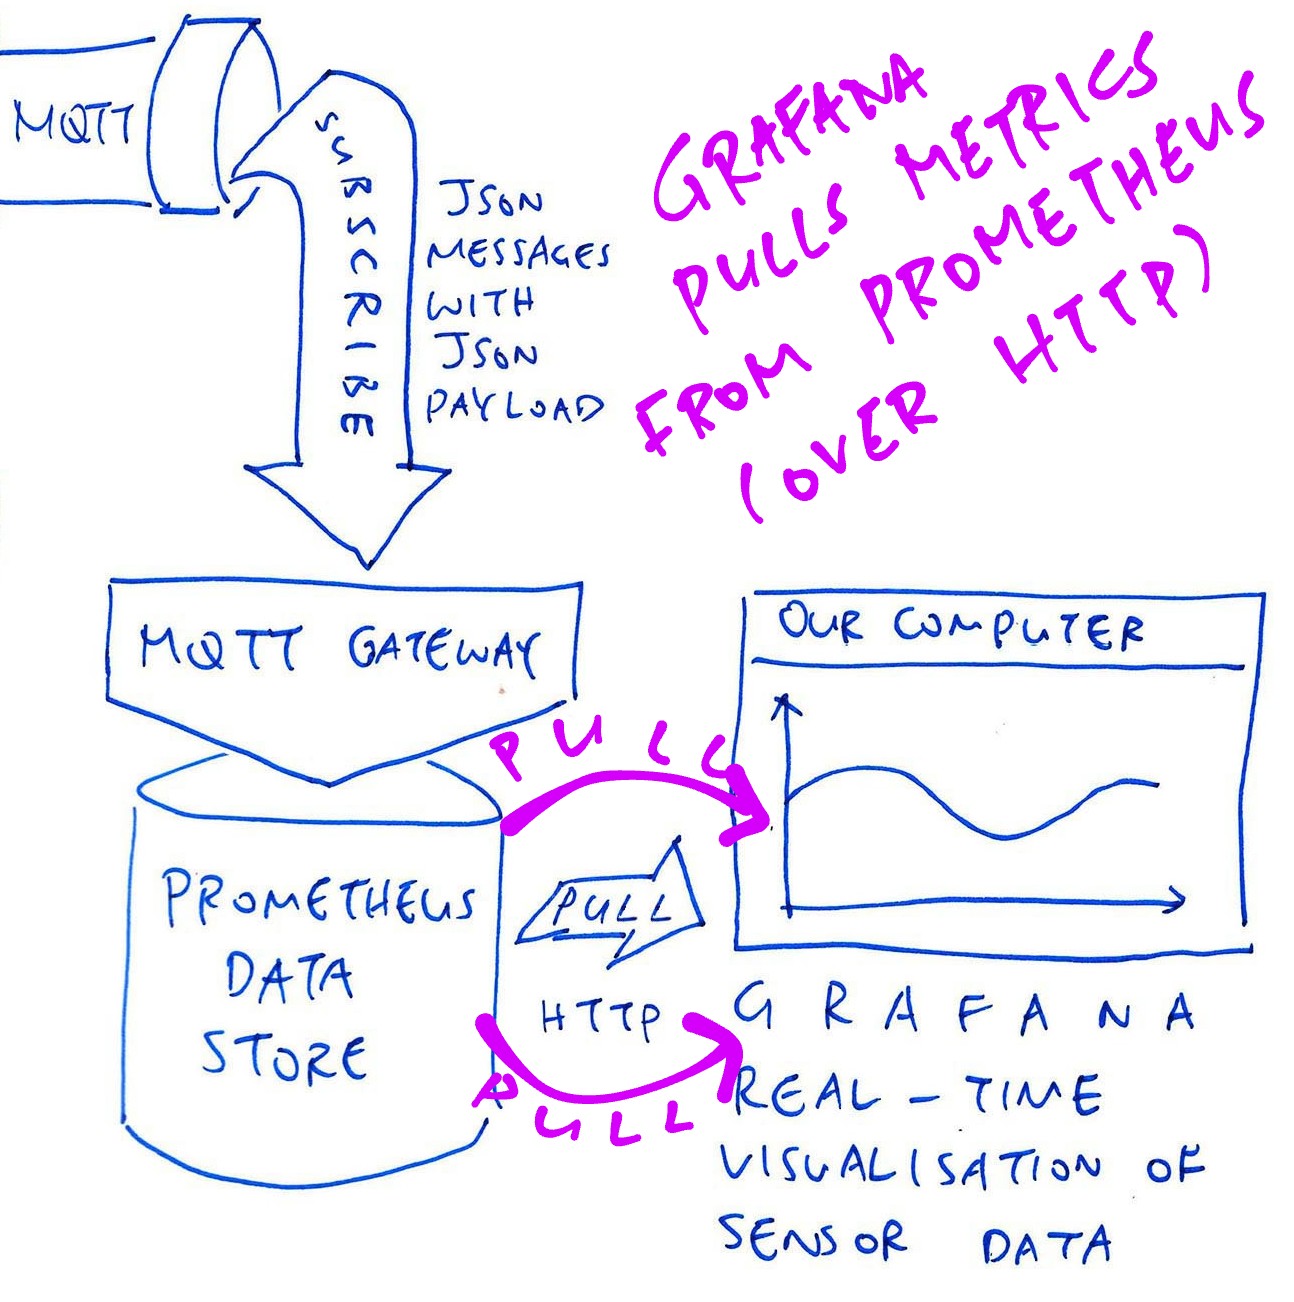
Finally we install and configure Grafana to pull the Metrics from Prometheus (over HTTP) for rendering in a Grafana Dashboard…
Follow the steps below to download and install Grafana…
Browse to our Grafana Server…
http://localhost:3000
Username: admin
Password: admin
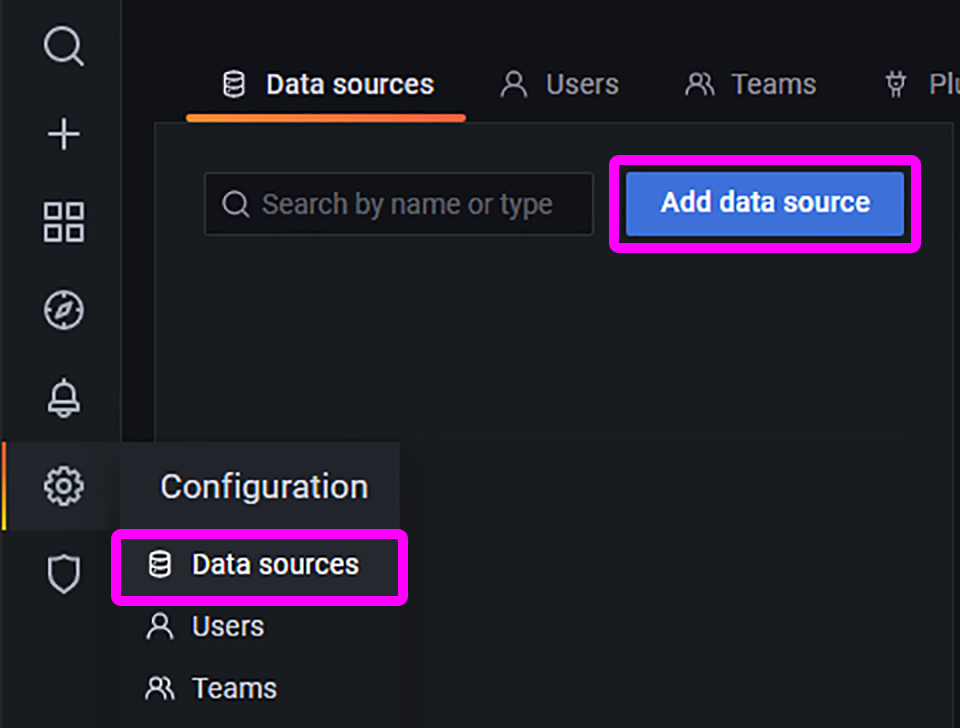
In the left menu bar, click…
Configuration → Data Sources
Click “Add Data Source”
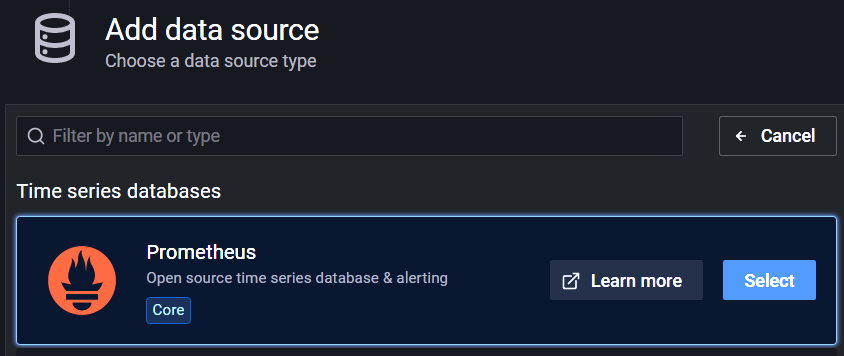
Look for “Prometheus” and click “Select”
Set the HTTP URL to…
http://localhost:9090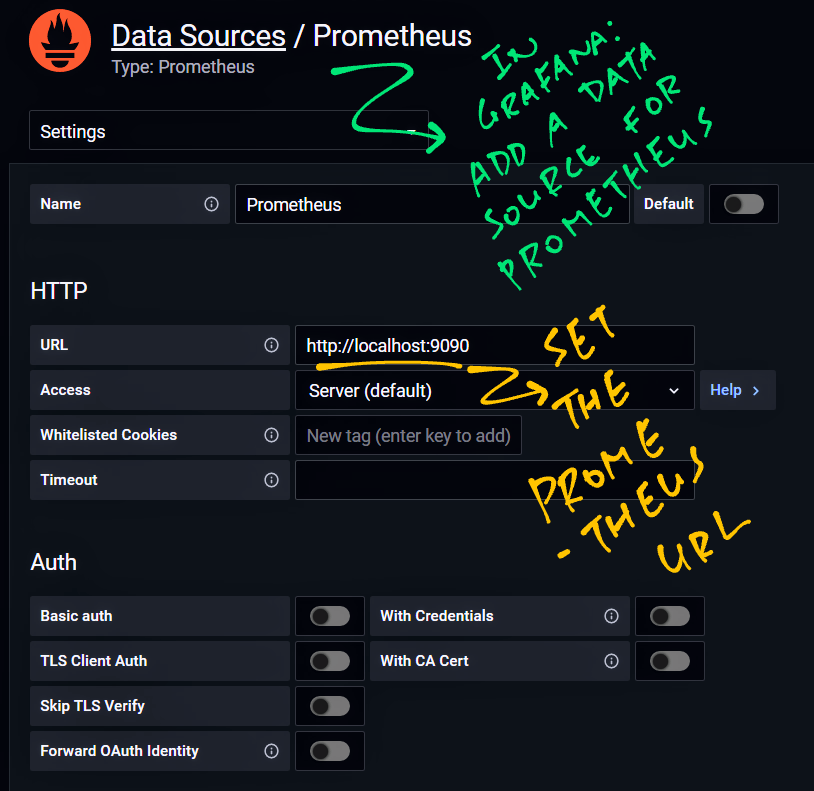
Click “Save & Test”
For our final checkpoint let’s render our Sensor Data in a Grafana Dashboard!
Start our LoRaWAN Firmware and transmit Sensor Data every minute
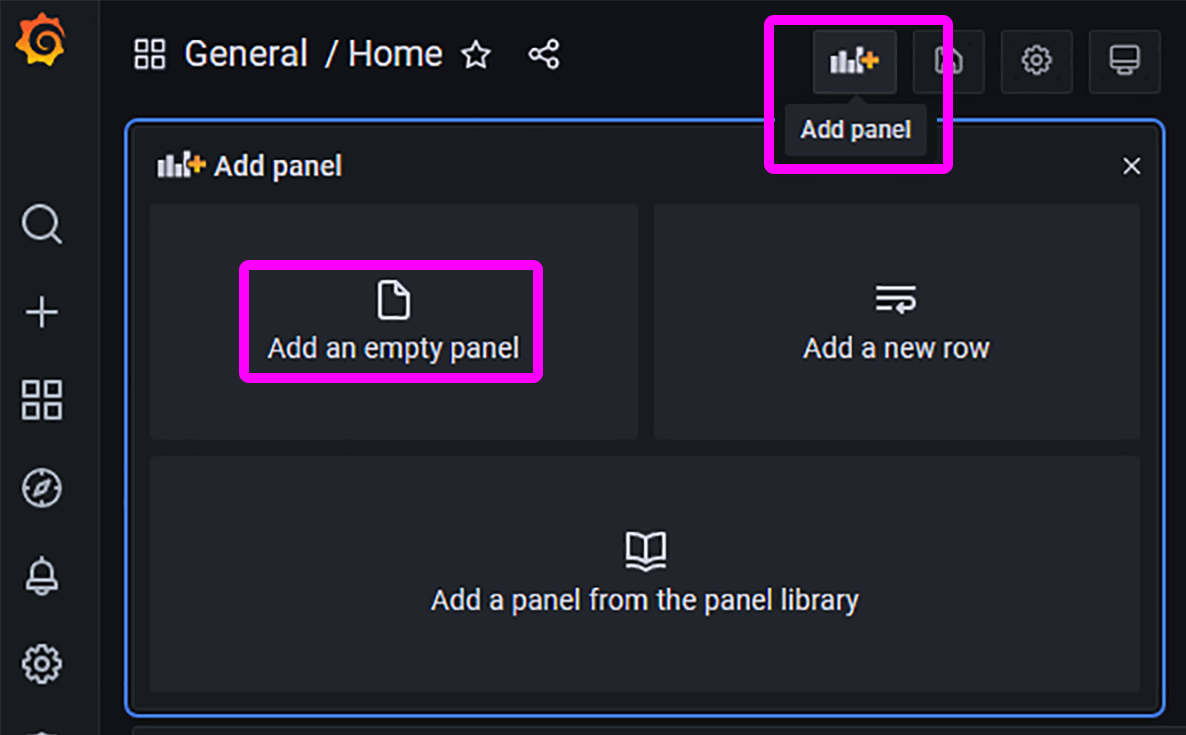
In Grafana, click “Add Panel” (top right)
Click “Add An Empty Panel”
Set the Data Source to “Prometheus”
Under Metric Browser: Enter the name of our Metric (like for Temperature)…
tLike this…
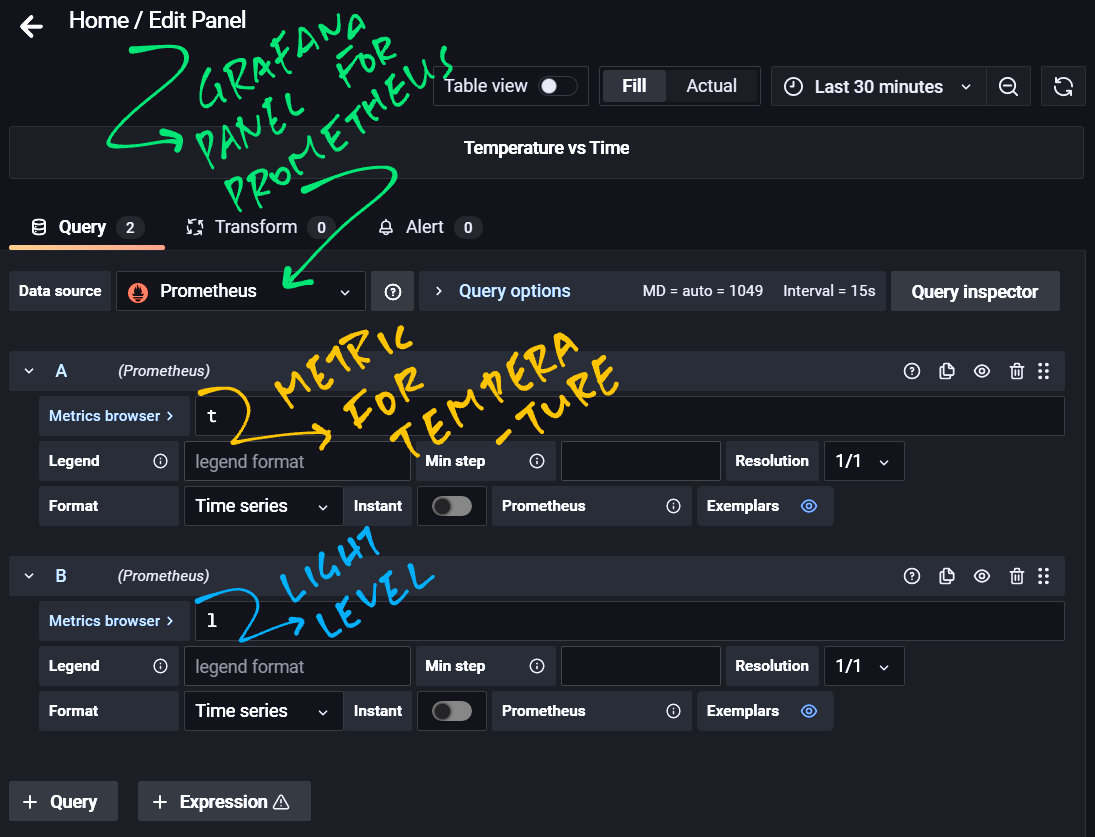
Click the “Save” button (top right)
Our Sensor Data from The Things Network appears in the Grafana Dashboard!
(Remember: Our Temperature Values are scaled up 100 times)
Can we tweak the display of Sensor Data in Grafana?
Grafana lets us transform and filter the Sensor Data for our Dashboard.
First we show the Raw Sensor Data as a table…
Click “Panel Title” and “Edit”
Click “Table View” (at top)
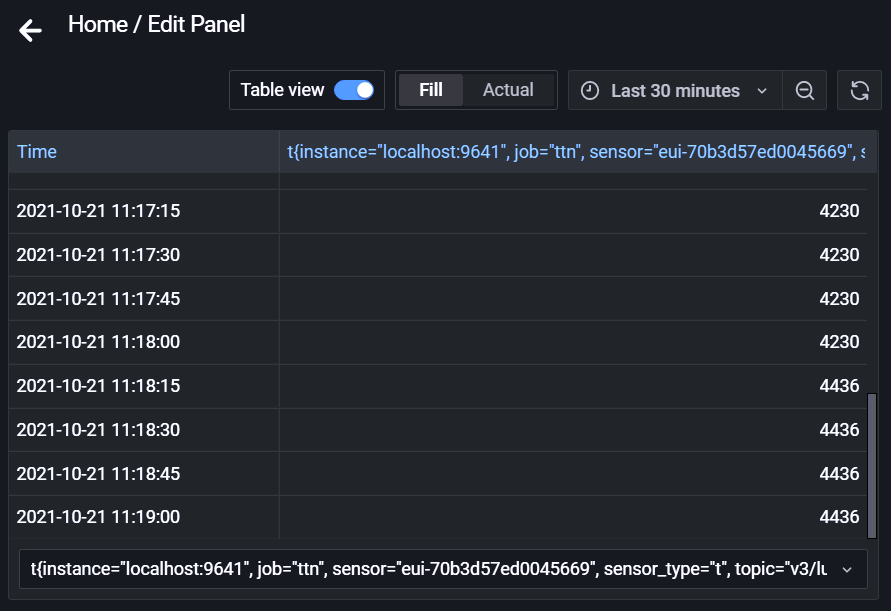
Not quite what we expected… Everything gets lumped into a single column!
Let’s split our Time Series Data into separate columns.
Click “Transform” Tab (at bottom)
Click “Add Transformation”
Select “Labels To Fields”
We should see this…
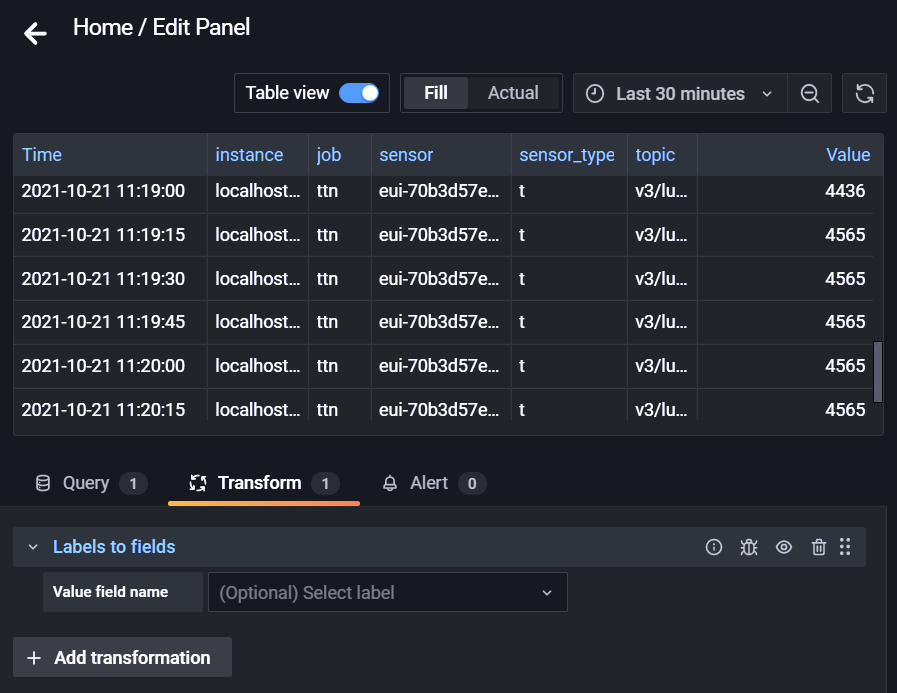
Much better! Our Device ID (“sensor”), Sensor Type (“t”) and Value are now in separate columns.
If we’re rendering Multiple Devices or Sensor Types, we should set the Value Field Name
Next we filter the Sensor Data that will be rendered in our Dashboard…
Click “Transform” Tab (at bottom)
Click “Add Transformation”
Select “Filter Data By Values”
Click “Add Condition” and set the Condition…
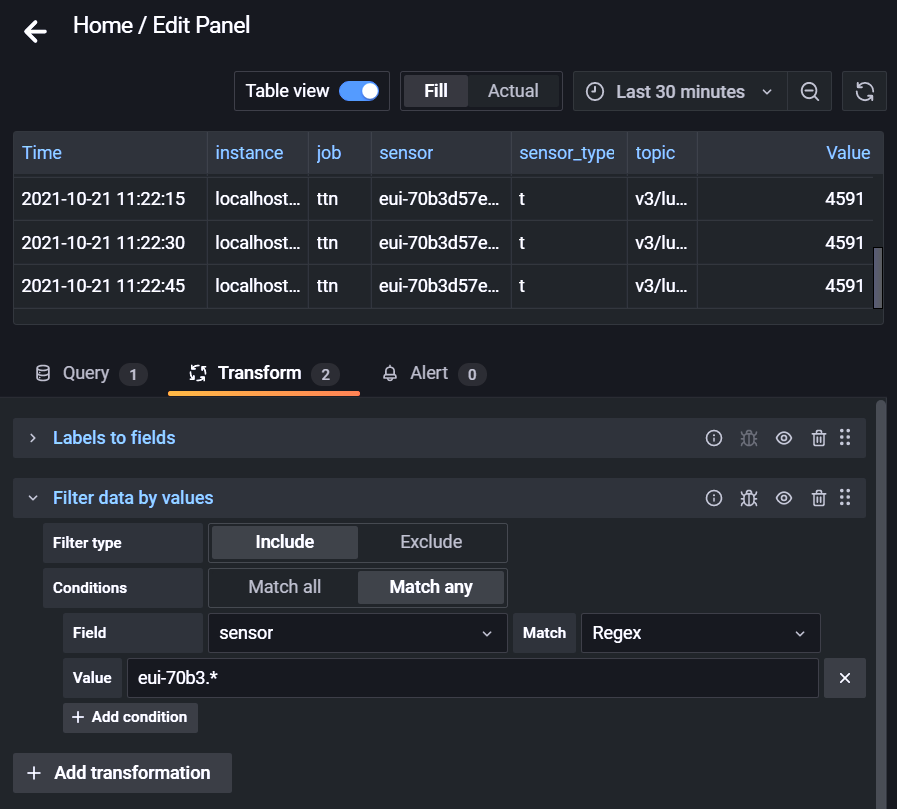
The above filter matches the Device ID with the Regular Expression…
eui-70b3.*Which means that only Device IDs starting with “eui-70b3” will be rendered.
When we’re done, click the “Apply” button (top right)
Our Grafana Dashboard doesn’t refresh automatically for real-time Sensor Data?
No worries! This neat trick will auto-refresh our Grafana Dashboard to render real-time Sensor Data…
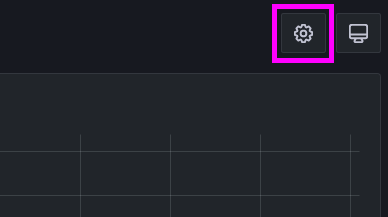
In our Grafana Dashboard, click the “Settings” button (top right)
Under “Time Options”, uncheck “Hide Time Picker”
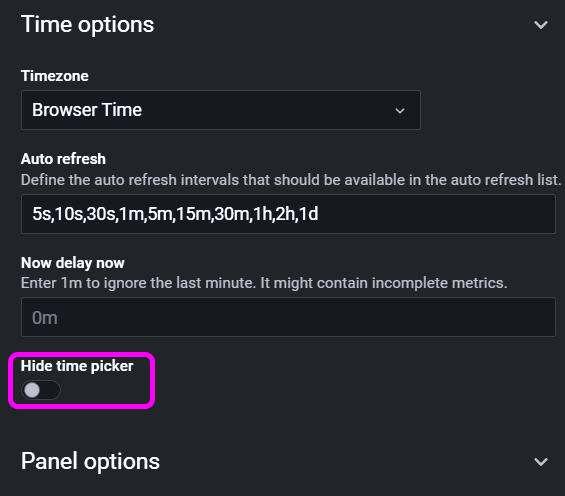
Click “Save Dashboard”
Click the “Refresh Interval” (top right)
Select “5 Seconds”
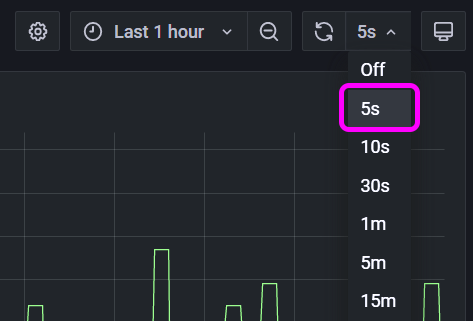
Now our Grafana Dashboard auto-refreshes every 5 seconds!
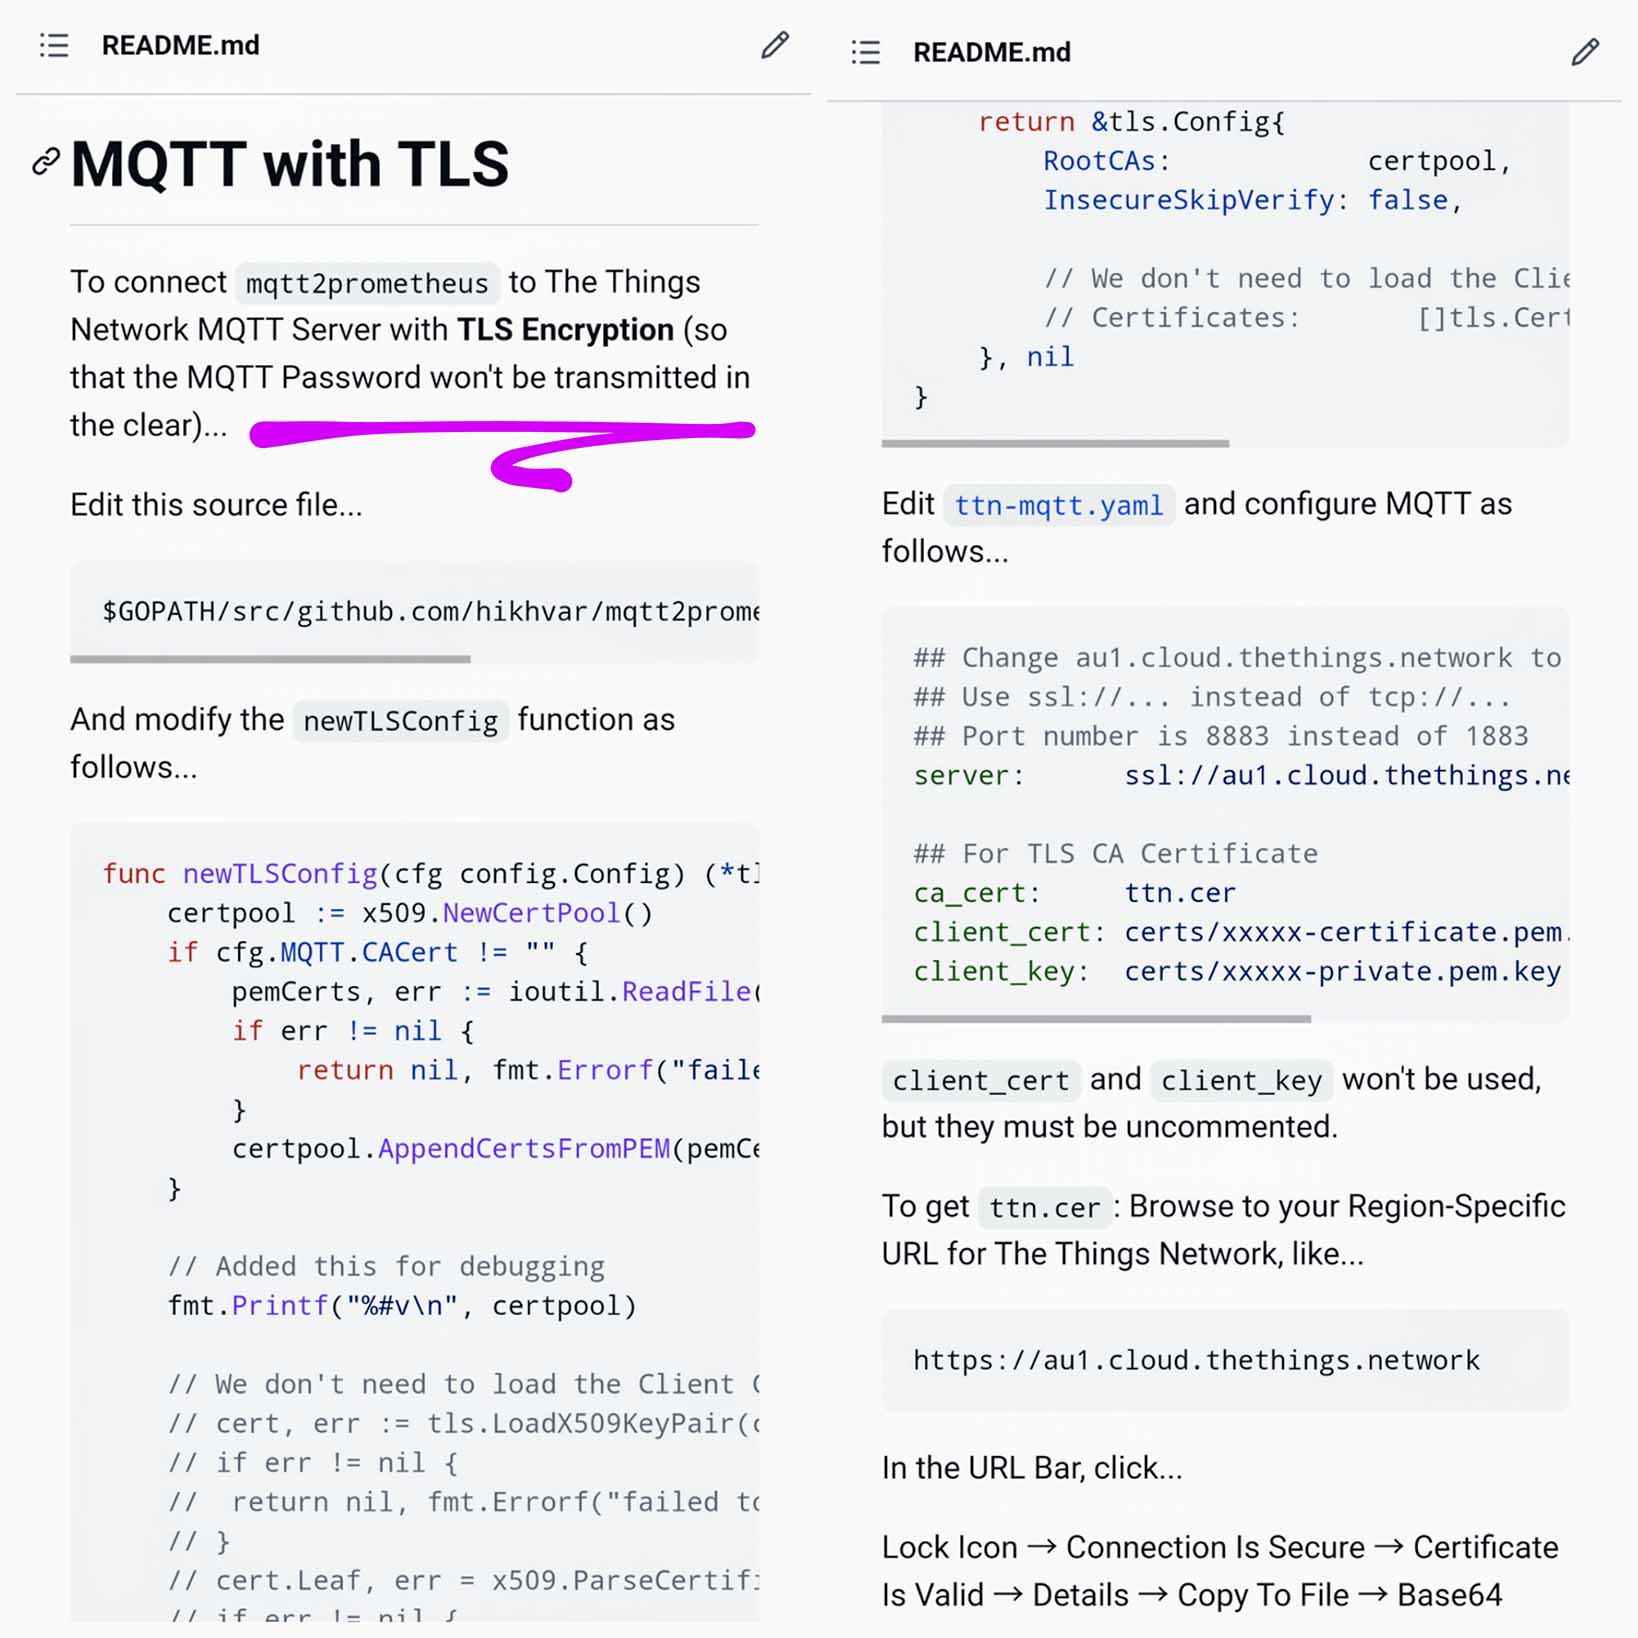
There’s a Security Risk in our configuration of MQTT Gateway…
Our MQTT Password is transmitted as clear text from our computer to The Things Network!
To secure our MQTT Password with TLS Encryption, follow the instructions here…
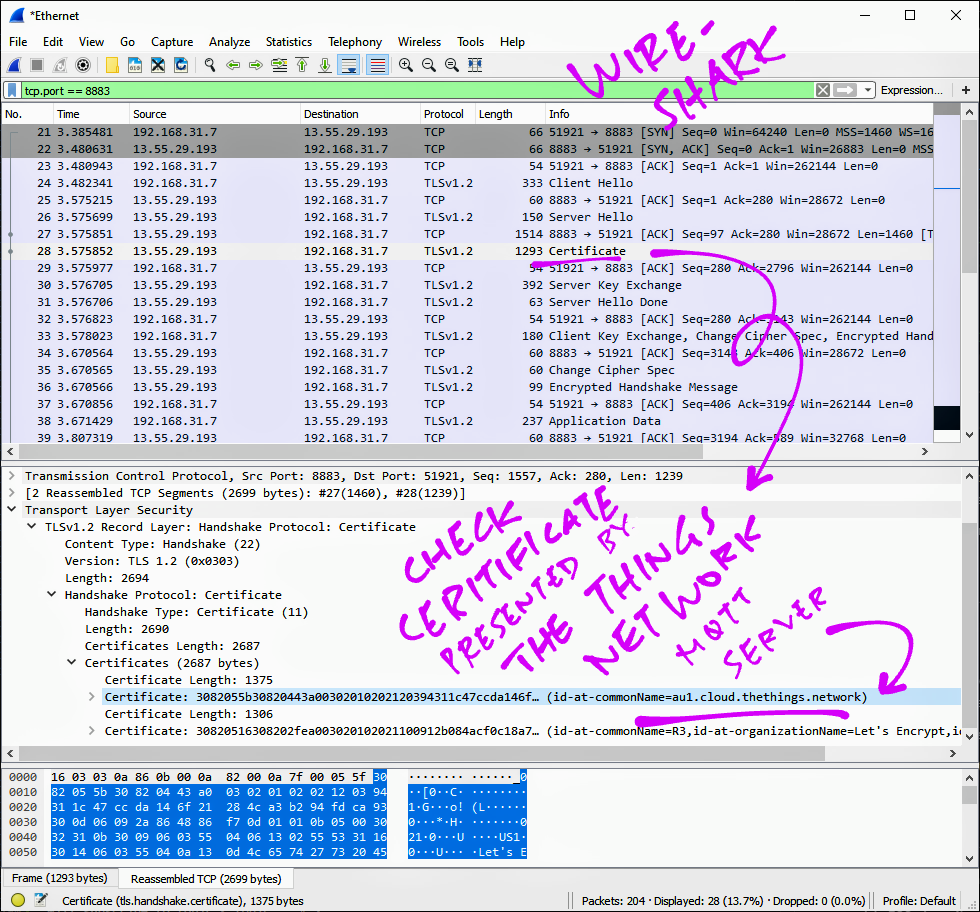
What if we have problems enabling TLS Encryption for MQTT?
Run Wireshark on our computer and trace the TLS Certificates that are presented by The Things Network and by our computer.
The certificates should appear like this…
Can we create Alerts for monitoring our Sensor Data?
Like when the Temperature gets too hot?
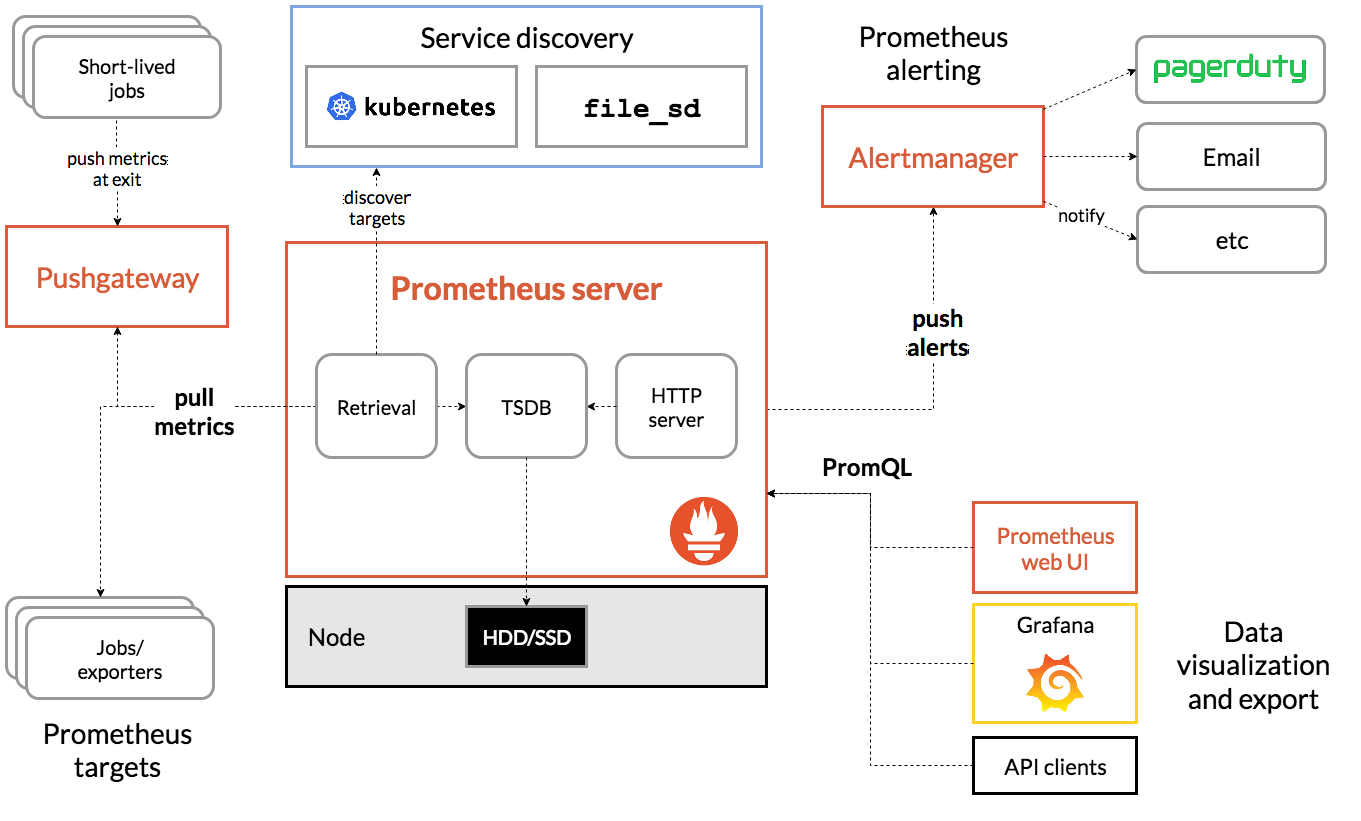
Yes that’s possible with Prometheus Alert Manager!
“The Alertmanager handles alerts sent by client applications such as the Prometheus server.”
“It takes care of deduplicating, grouping, and routing them to the correct receiver integration such as email, PagerDuty, or OpsGenie.”
“It also takes care of silencing and inhibition of alerts.”
More details here…
Drop me a note if you’re keen to learn about Prometheus Alerts!
I had fun integrating The Things Network with Prometheus and Grafana… It’s something I always wanted to do. I hope you enjoyed it too!
In the next article I’ll head back to PineDio Stack BL604 and run more IoT Experiments with LoRaWAN and The Things Network.
(Thankfully we now have a proper platform for Sensor Data visualisation and analysis: Prometheus + Grafana!)
Many Thanks to my GitHub Sponsors for supporting my work! This article wouldn’t have been possible without your support.
Got a question, comment or suggestion? Create an Issue or submit a Pull Request here…
lupyuen.github.io/src/prometheus.md
If we’re rendering Multiple Sensor Types in a Grafana Panel (like Temperature and Light Level)…
Set Labels To Fields → Value Field Name to “sensor_type”…
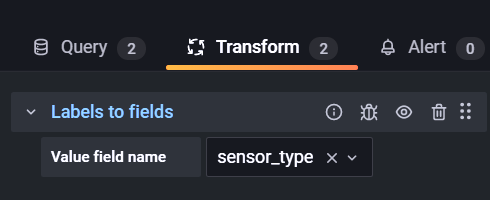
This fixes the graph to plot one line per Sensor Type.
If we’re rendering Multiple Devices in a Grafana Panel…
Set Labels To Fields → Value Field Name to “sensor”…
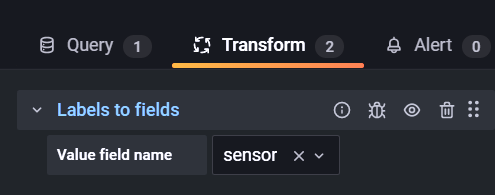
This fixes the graph to plot one line per Device.
Why not use an SQL Database (like MySQL) instead of Prometheus?
Well an SQL Database might not scale up for high volumes of Sensor Data because…
SQL Inserts can be costly, due to the frequent indexing. If we run SQL Select queries too often, we might have contention in the SQL Index.
SQL doesn’t work well with time-based queries like “What’s the average daily temperature every day for the past year”. It gets tedious to code such queries (nested SQL) and they don’t perform well.
That’s why we use a Time Series Database like Prometheus. And when we use a Time Series Database, we need a tool like Grafana that can visualise the Time Series Data.
This article is the expanded version of this Twitter Thread
Follow these steps to enable the MQTT Server in The Things Network…
Log on to The Things Network Console
Click Applications → (Your Application) → Integrations → MQTT
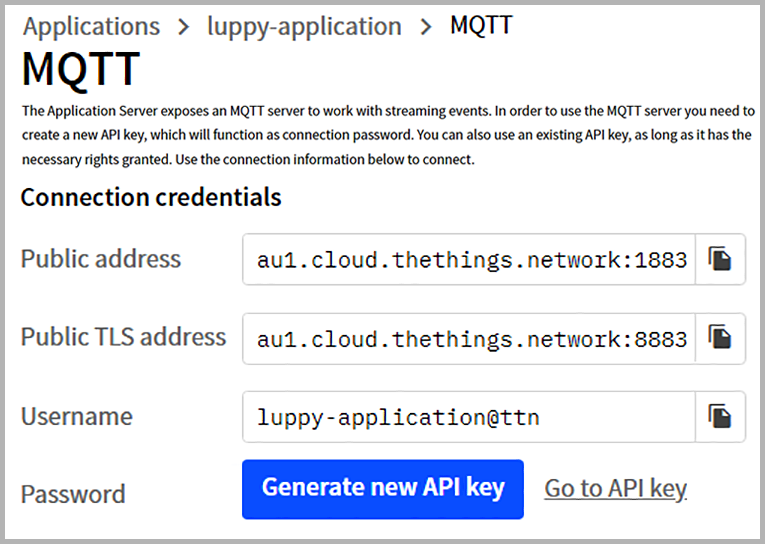
Click “Generate New API Key” and copy the values for…
Public Address
Username
Password
(This is the only time we can see the password. Don’t forget to copy it!)
Follow these steps to install Grafana on Linux, macOS and Windows…
Browse to grafana.com/oss/grafana
Click “Get Grafana → Self-Managed → Download Grafana”
For “Edition” select “OSS”
Click Linux, macOS, Windows, Arm or Docker
(Grafana for Linux works on WSL too)
Follow the instructions to download and install Grafana
For Linux and macOS: Start the Grafana Server
## For Ubuntu and WSL
sudo service grafana-server restart
sudo service grafana-server status

## For macOS
brew services start grafana
To test Grafana, browse to
http://localhost:3000
Username: admin
Password: admin
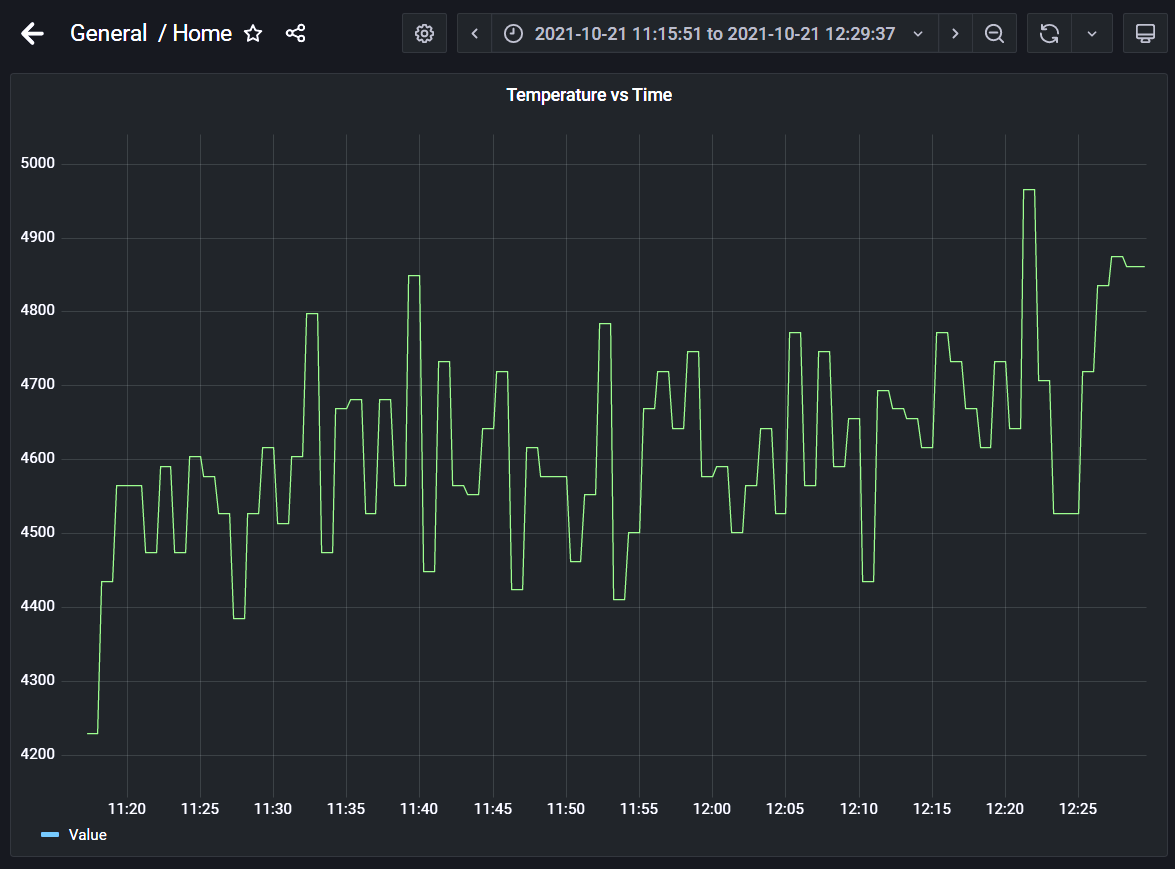
Grafana rendering PineDio Stack’s Internal Temperature over a one-hour period, thanks to Prometheus and The Things Network