📝 27 Sep 2021
UPDATE: There’s a better way to connect Grafana to The Things Network, see this
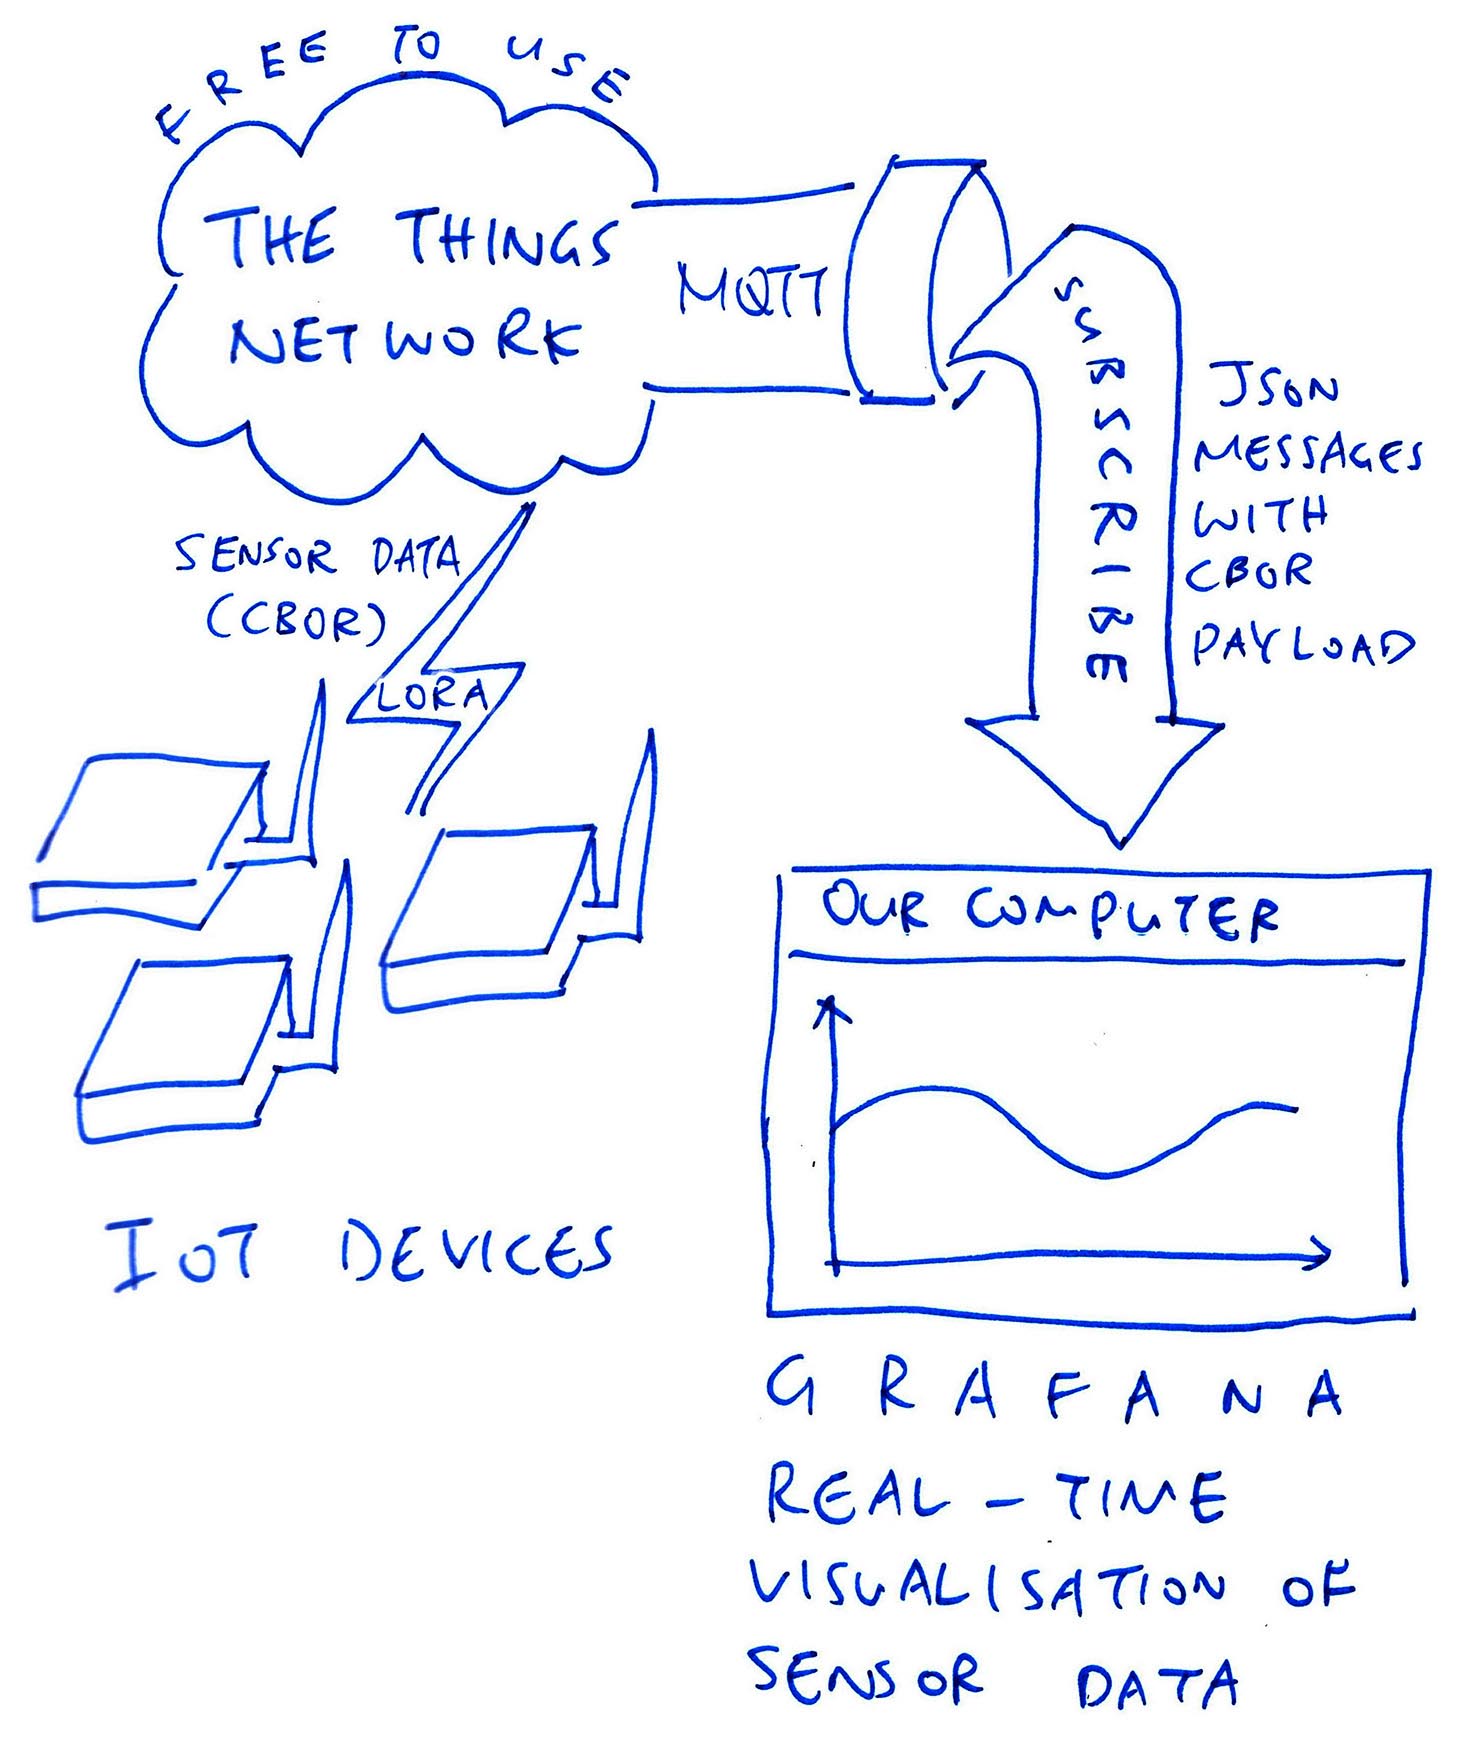
The Things Network is a public global wireless network for IoT devices…
(And it’s free for fair use!)
Grafana is a open source tool for visualising all kinds of real-time data…
(Works on Linux, macOS and Windows)
Can we connect Grafana to The Things Network…
And instantly visualise the Sensor Data from our IoT Devices?
Today we shall experiment with a custom MQTT Data Source for Grafana that will stream real-time Sensor Data from The Things Network.
Wait… We’re streaming the Sensor Data without storing it?
Yep this streaming setup for Grafana requires fewer components because it doesn’t store the data.
But it has limitations, which we’ll discuss shortly.
(This is work-in-progress, some spot may get rough. And please pardon my ghastly GoLang 🙏)
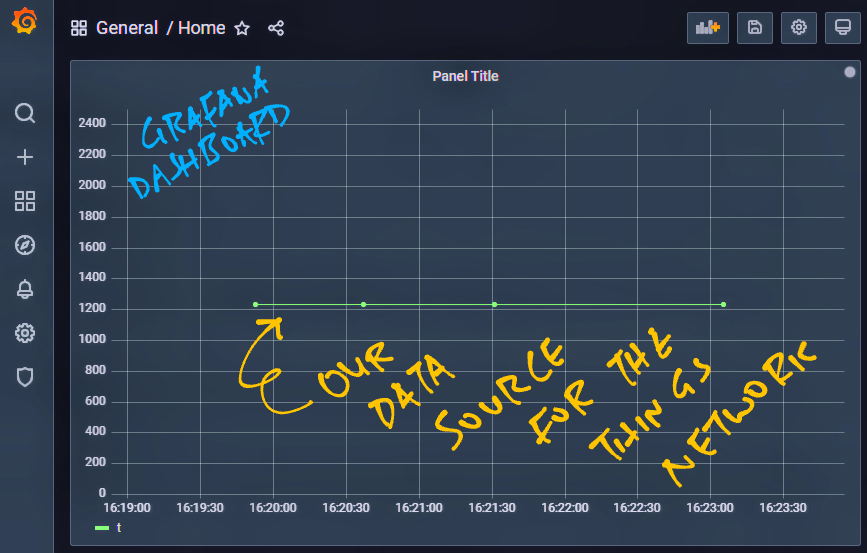
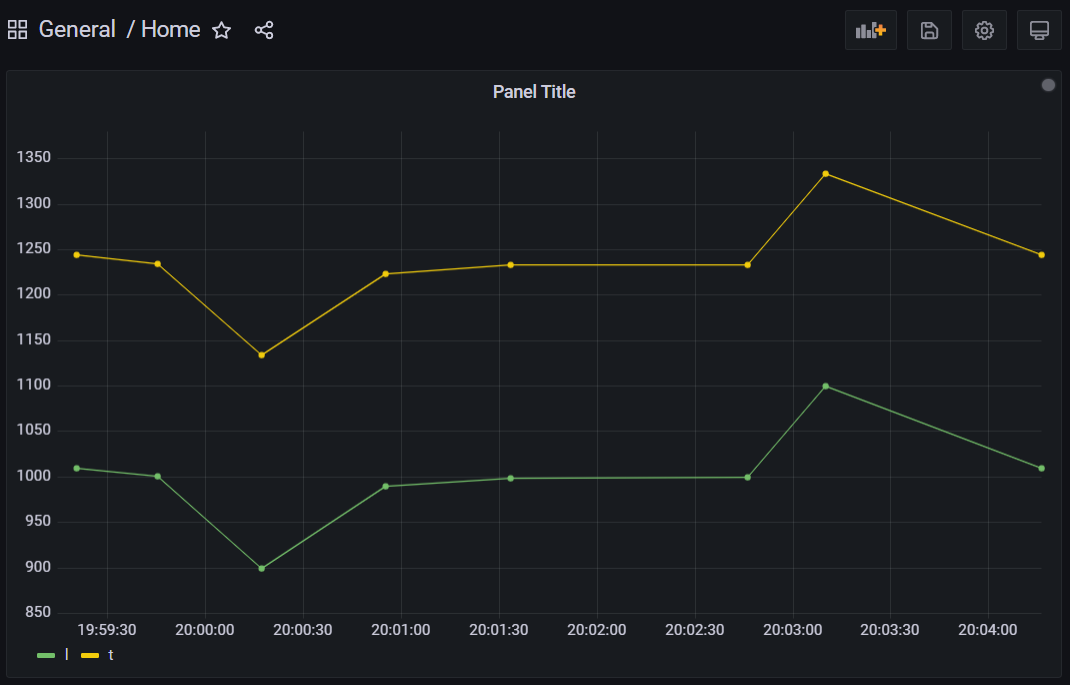
Grafana visualising Sensor Data from The Things Network
Previously we have configured our IoT Device in The Things Network…
Now we enable the MQTT Server in The Things Network by clicking…
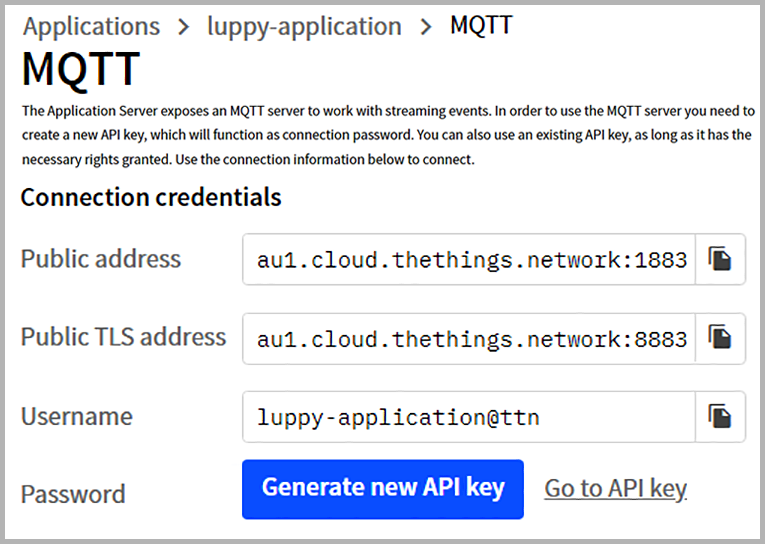
Click “Generate New API Key” and copy the values for…
Public Address
(We won’t be using the Public TLS Address since our Data Source doesn’t support TLS)
Username
Password
(This is the only time we can see the password. Don’t forget to copy it!)
We’ll use the values in the next chapter.
To test the MQTT Server at The Things Network, enter this command…
## Change au1.cloud.thethings.network to our MQTT Public Address
## Change luppy-application@ttn to our MQTT Username
mosquitto_sub -h au1.cloud.thethings.network -t "#" -u "luppy-application@ttn" -P "YOUR_API_KEY" -d
MQTT JSON Messages will appear whenever our IoT Device joins the network or transmits data.
(More about The Things Network MQTT)
Let’s add and configure our Grafana Data Source for The Things Network…
Follow these instructions to install Grafana and the Data Source for The Things Network…
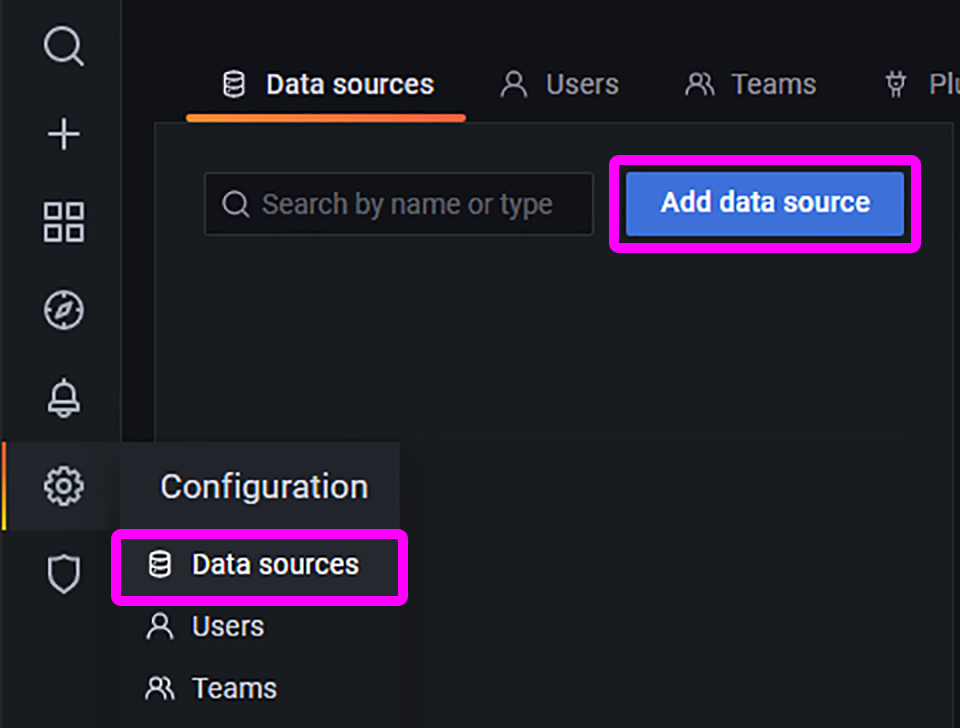
In Grafana, click the left menu bar…
Click “Add Data Source”
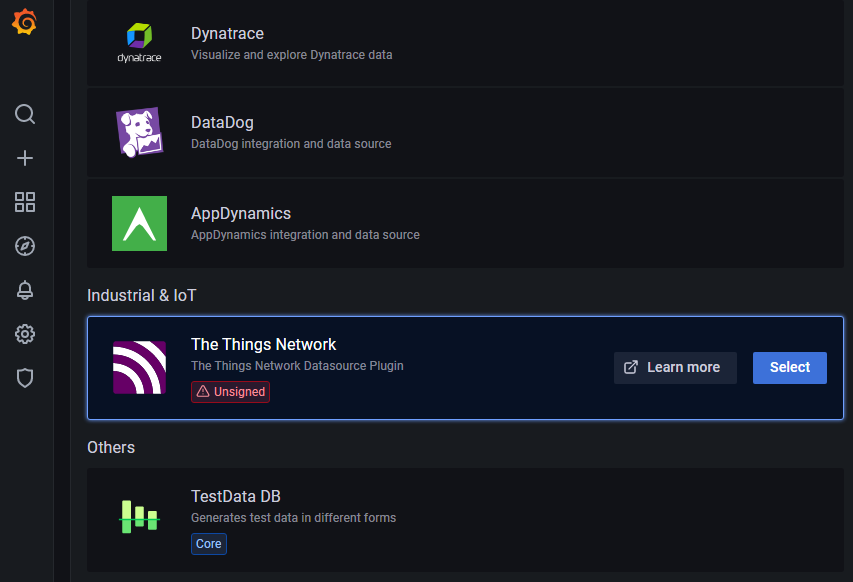
Look for “The Things Network” and click “Select”
Fill in the values copied from our MQTT Server at The Things Network…
Name: Use the default
Host: Public Address of our MQTT Server
Port: 1883
Username: Username for our MQTT Server
Password: Password for our MQTT Server
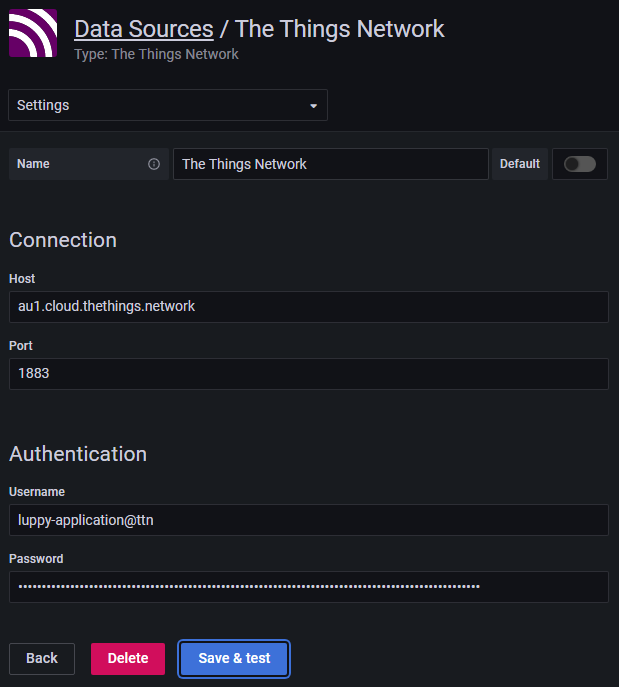
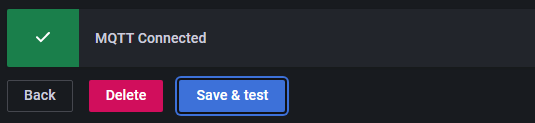
Click “Save & Test”
We should see the message “MQTT Connected”…
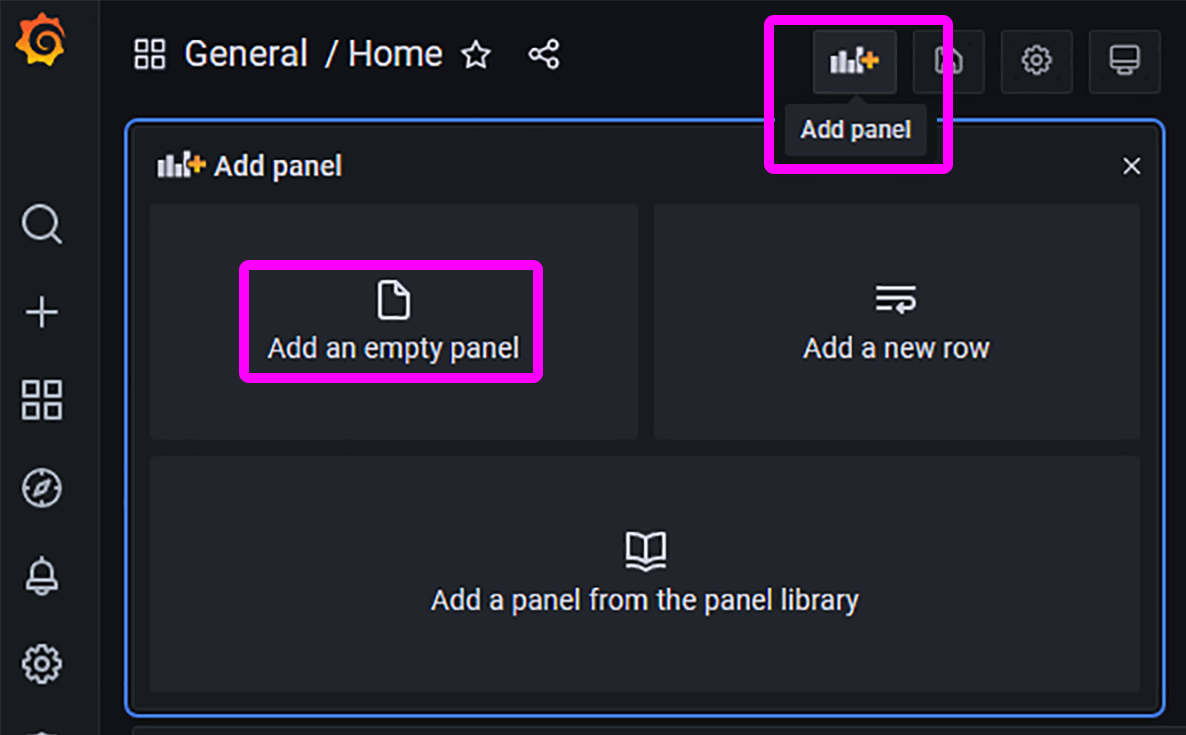
Let’s render the Sensor Data from The Things Network in Grafana!
Click “Add Panel” (top right)
Click “Add An Empty Panel”
Set the Data Source to “The Things Network”
Set the Topic to “all”
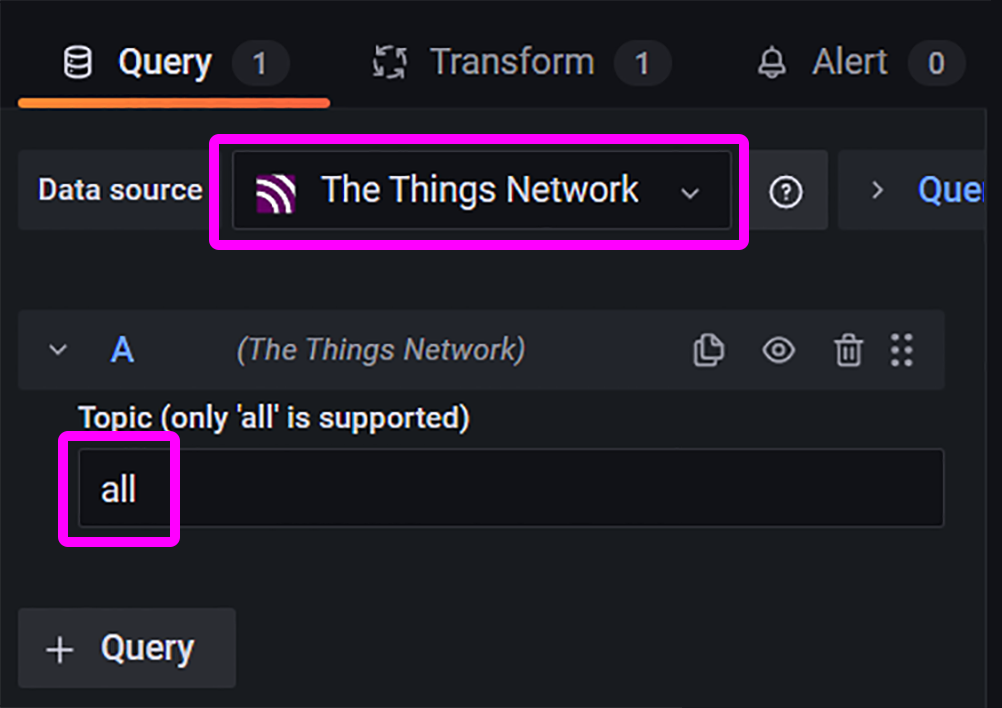
Click “Apply” (top right)
Our Sensor Data appears on the Grafana Dashboard!
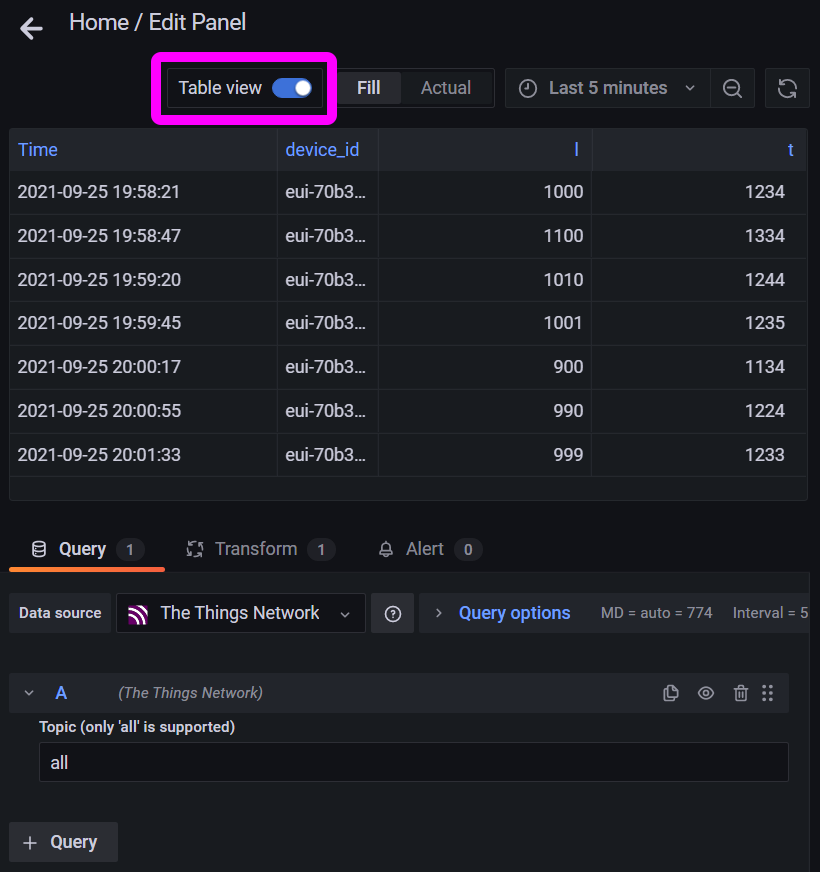
To see the Raw Sensor Data as a table…
Click “Panel Title” and “Edit”
Click “Table View”
To filter the Sensor Data that will be rendered in the dashboard…
Click the “Transform” Tab
Select “Filter Data By Values”
Set the Conditions and click “Apply”
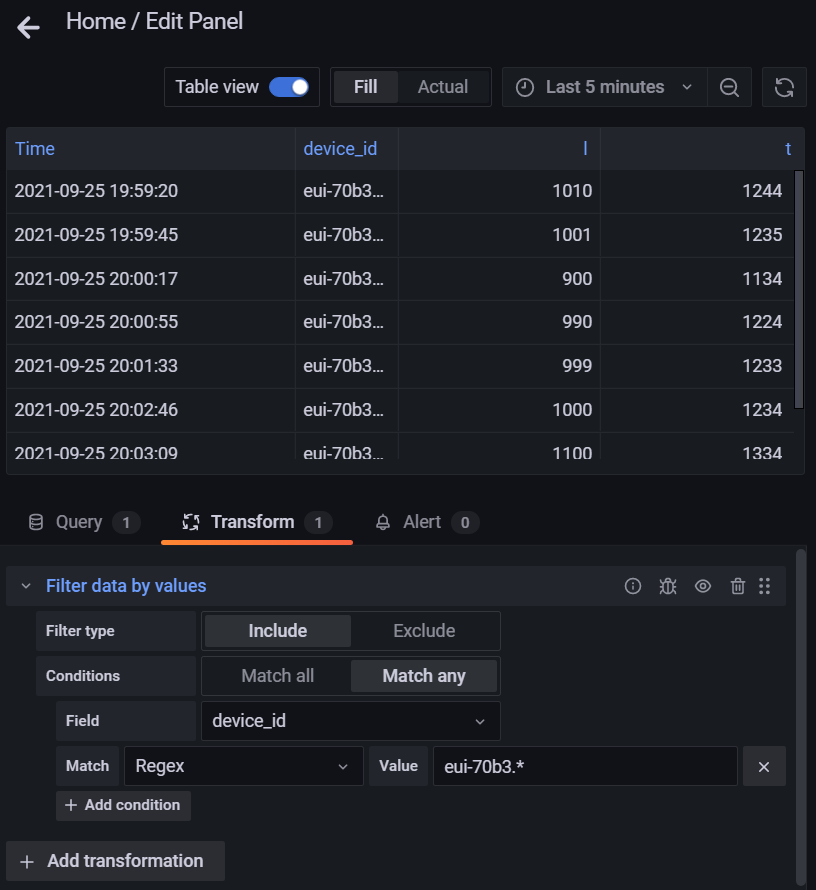
The above filter matches the Device ID with the Regular Expression…
eui-70b3.*Which means that only Device IDs starting with “eui-70b3” will be rendered.
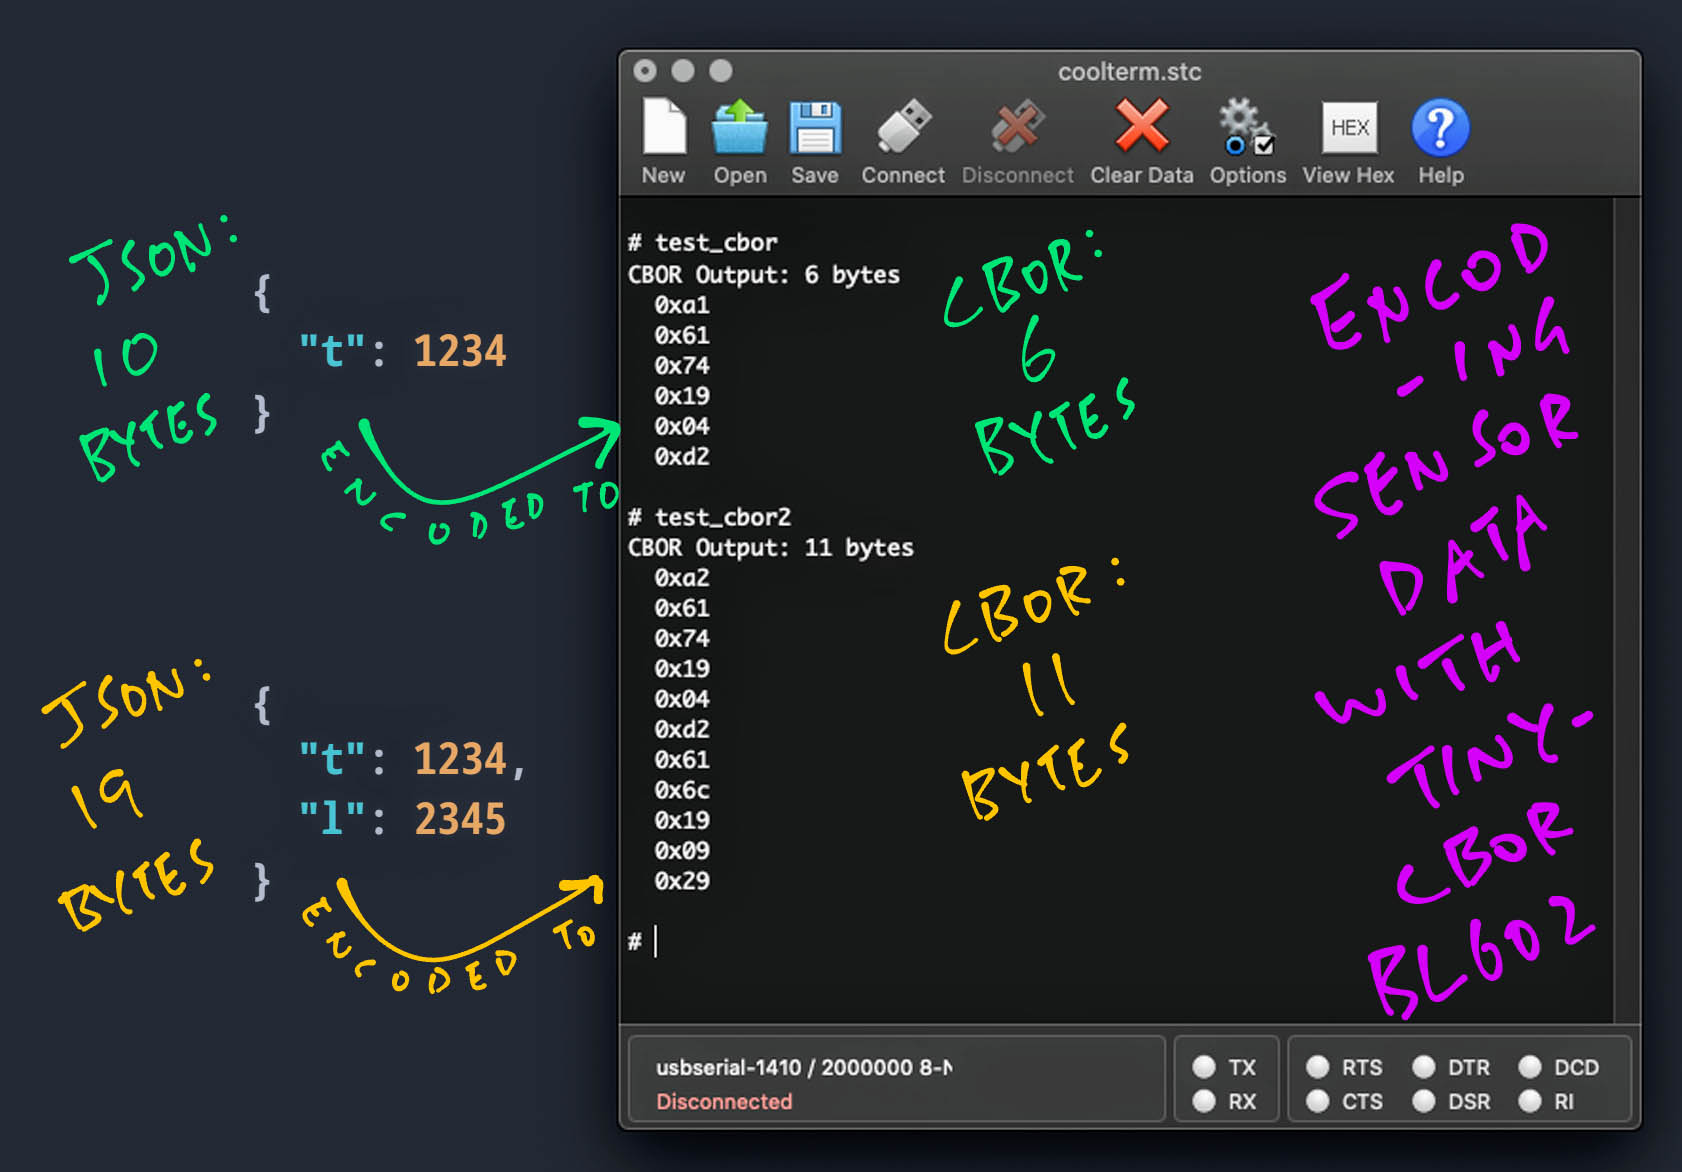
The Sensor Data we’ve seen earlier… Was it encoded as JSON?
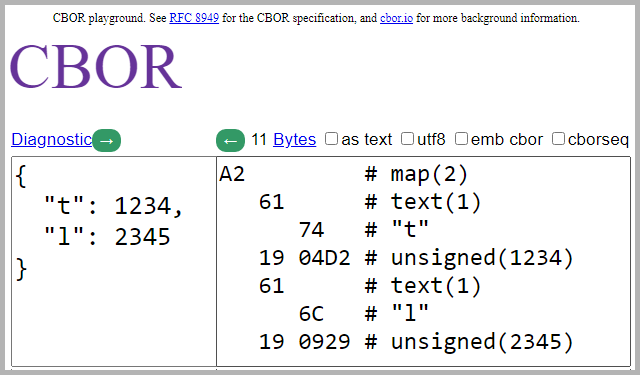
Not quite. If we encode the Sensor Data as JSON…
{
  "t": 1234,
  "l": 2345
}
We’ll need 19 bytes to transmit the Sensor Data.
Which might be too much for The Things Network.
What are the message limits for The Things Network?
The Things Network is Free for Fair Use, with limits on the size of messages and how often we may send them.
If we expect to send 10 messages per hour, our Message Payload should not exceed 12 bytes.
Thus our Message Payload is too small for JSON! We’ll encode with CBOR instead.
(More about The Things Network limits)
What is CBOR?
Concise Binary Object Representation (CBOR) works like a binary, compressed form of JSON…
Our Data Source for The Things Network assumes that the Message Payload is encoded with CBOR.
To experiment with CBOR, try the CBOR Playground…
(More about CBOR implementations)
Our Data Source calls this Go Library to decode CBOR Message Payloads…
We call the library like so…
import "github.com/fxamacker/cbor/v2"

//  Encoded CBOR payload for { "t": 1234, "l": 2345 }
payload := []byte{0xa2, 0x61, 0x74, 0x19, 0x04, 0xd2, 0x61, 0x6c, 0x19, 0x09, 0x29}

//  Decode CBOR payload to a map of string → interface{}
var body map[string]interface{}
err := cbor.Unmarshal(payload, &body)

//  Shows: map[l:2345 t:1234]
if err == nil {
  fmt.Printf("%v\n", body)
}
Later we’ll see the decoding logic in our Data Source.
Where is the Message Payload?
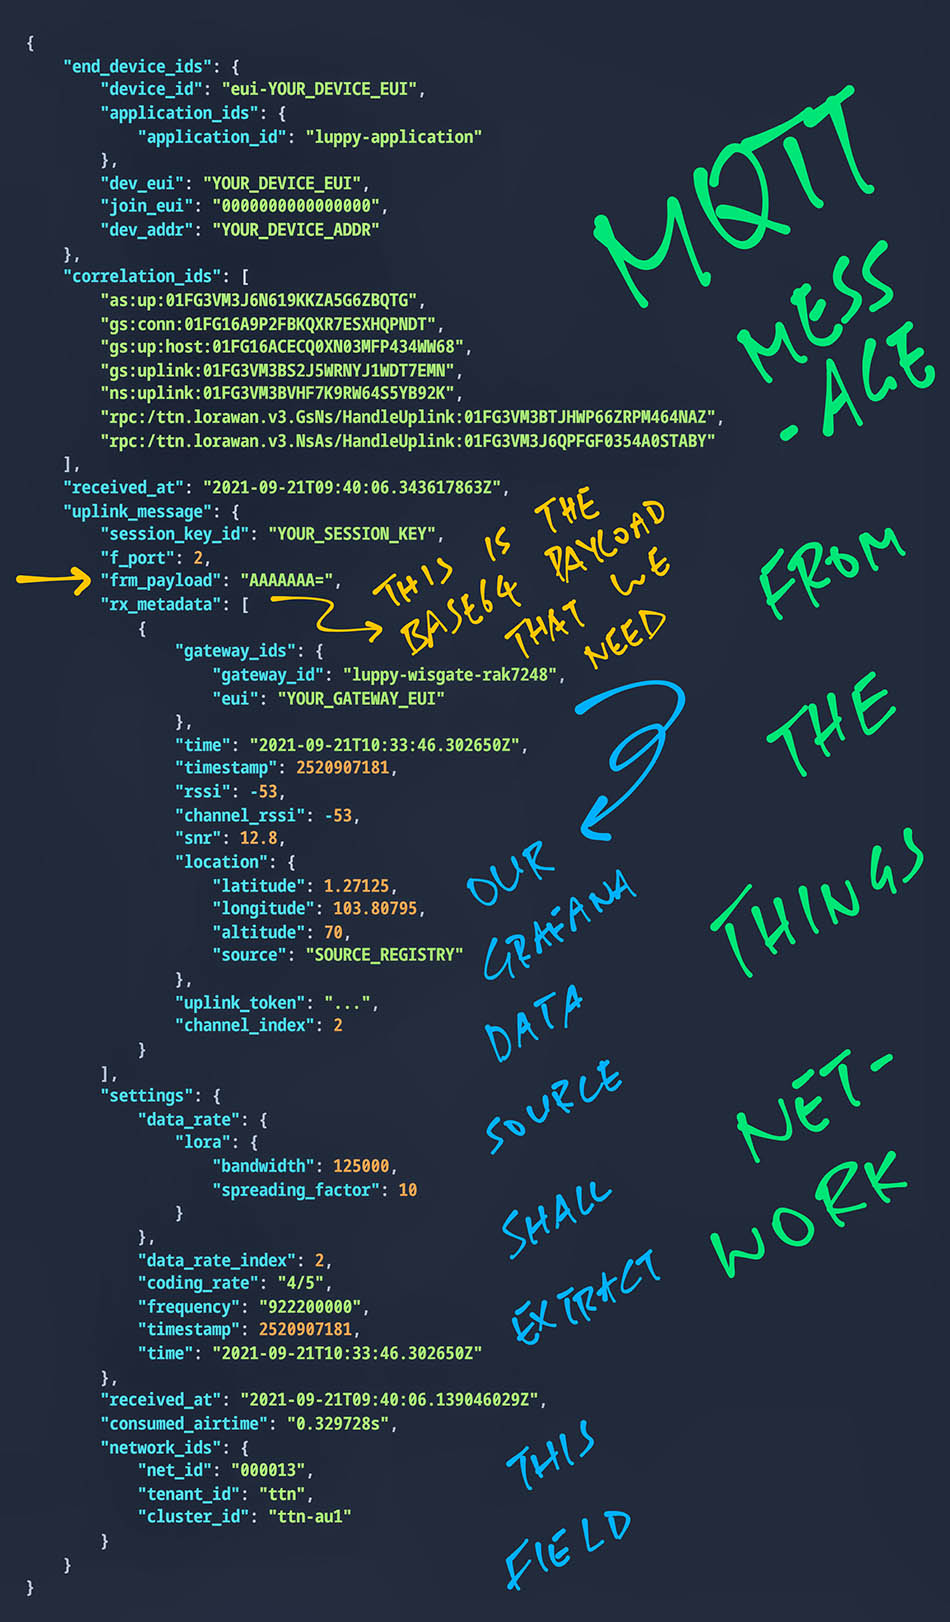
Our CBOR Message Payload is embedded deep inside the MQTT Message from The Things Network…
{
  "end_device_ids": {
    "device_id": "eui-YOUR_DEVICE_EUI",
    "application_ids": {
      "application_id": "YOUR_APPLICATION_ID"
    },
    "dev_eui":  "YOUR_DEVICE_EUI",
    "join_eui": "0000000000000000",
    "dev_addr": "YOUR_DEV_ADDR"
  },
  "correlation_ids": [ ... ],
  "received_at":     "2021-09-25T13:46:17.083379844Z",
  "uplink_message":  {
    "session_key_id":  "YOUR_SESSION_KEY_ID",
    "f_port":          2,
"frm_payload": "omF0GQTSYWwZA+g=",frm_payload contains our CBOR Message Payload, encoded with Base64.
We’ll watch the extraction of the Message Payload in a while.
Let’s look at the Go Source Code for our Data Source…
Our Data Source is modded from the MQTT Data Source for Grafana…
Here’s how our Data Source subscribes to MQTT Topics: pkg/mqtt/client.go
//  Name of our default topic
//  TODO: Support other topics
const defaultTopicName = "all"

//  We will subscribe to all MQTT topics
//  TODO: Support other topics
const defaultTopicMQTT = "#"

//  Subscribe to the topic.
//  We assume that the Topic Name is "all".
func (c *Client) Subscribe(t string) {
  //  If Topic Name already exists, quit
  if _, ok := c.topics.Load(t); ok {
    return
  }

  //  Create the topic: "all"
  topic := Topic{
    path: t,
  }
  c.topics.Store(&topic)

  //  Subscribe to all MQTT Topics: "#". TODO: Support other topics.
  //  Previously: c.client.Subscribe(t, 0, c.HandleMessage)
  c.client.Subscribe(defaultTopicMQTT, 0, c.HandleMessage)
}
Sorry this code looks wonky…
(Because I haven’t decided which topics we should support)
We subscribe to all MQTT Topics: “#”
This means we will receive MQTT Messages for all our devices.
Also we will receive all types of messages, including the “Join Network” messages.
However “#” is not a valid Topic Name in our Grafana Data Source. (Not sure why it fails)
Hence we use “all” as the substitute Topic Name for the “#” MQTT Topic.
Incoming MQTT Messages are handled by this function: pkg/mqtt/client.go
//  Handle incoming MQTT messages
func (c *Client) HandleMessage(_ paho.Client, msg paho.Message) {
  //  Assume that the topic is "all". TODO: Support other topics.
  //  Previously: topic, ok := c.topics.Load(msg.Topic())
  topic, ok := c.topics.Load(defaultTopicName)
  if !ok {  //  Topic not found, quit
    return
  }

  //  Compose message
  message := Message{
    Timestamp: time.Now(),
    Value:     string(msg.Payload()),
  }
We begin by composing a Message object that will be processed later.
Sorry again for this horrible hack: We reject messages without a valid CBOR Base64 Payload…
  //  TODO: Fix this hack to reject messages without a valid CBOR Base64 Payload.
  //  CBOR Payloads must begin with a CBOR Map: 0xA1 or 0xA2 or 0xA3 or ...
  //  So the Base64 Encoding must begin with "o" or "p" or "q" or ...
  //  We stop at 0xB1 (Base64 "s") because we assume LoRaWAN Payloads will be under 50 bytes.
  //  Join Messages don't have a payload and will also be rejected.
  const frm_payload = "\"frm_payload\":\""
  if !strings.Contains(message.Value, frm_payload+"o") &&
    !strings.Contains(message.Value, frm_payload+"p") &&
    !strings.Contains(message.Value, frm_payload+"q") &&
    !strings.Contains(message.Value, frm_payload+"r") &&
    !strings.Contains(message.Value, frm_payload+"s") {
    log.DefaultLogger.Debug(fmt.Sprintf("Missing or invalid payload: %s", message.Value))
    return
  }
Next we store the Message object (keeping the most recent 1,000 messages)…
  //  Store message for query
  topic.messages = append(topic.messages, message)

  //  Limit the size of the retained messages
  if len(topic.messages) > 1000 {
    topic.messages = topic.messages[1:]
  }

  //  Update the topic messages
  c.topics.Store(topic)
Then we stream the message to a channel…
  //  Stream message to topic "all". TODO: Support other topics.
  //  Previously: streamMessage := StreamMessage{Topic: msg.Topic(), Value: string(msg.Payload())}
  streamMessage := StreamMessage{Topic: defaultTopicName, Value: string(msg.Payload())}
  select {
  case c.stream <- streamMessage:
  default:
    //  Don't block if nothing is reading from the channel
  }
}
What happens next? Read on and find out…
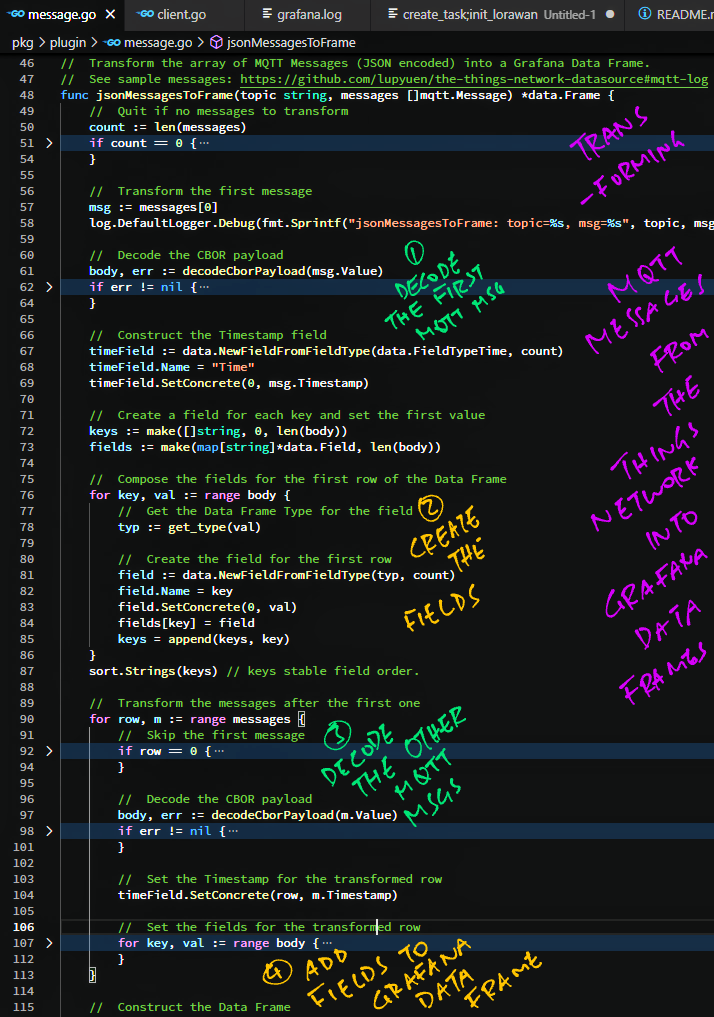
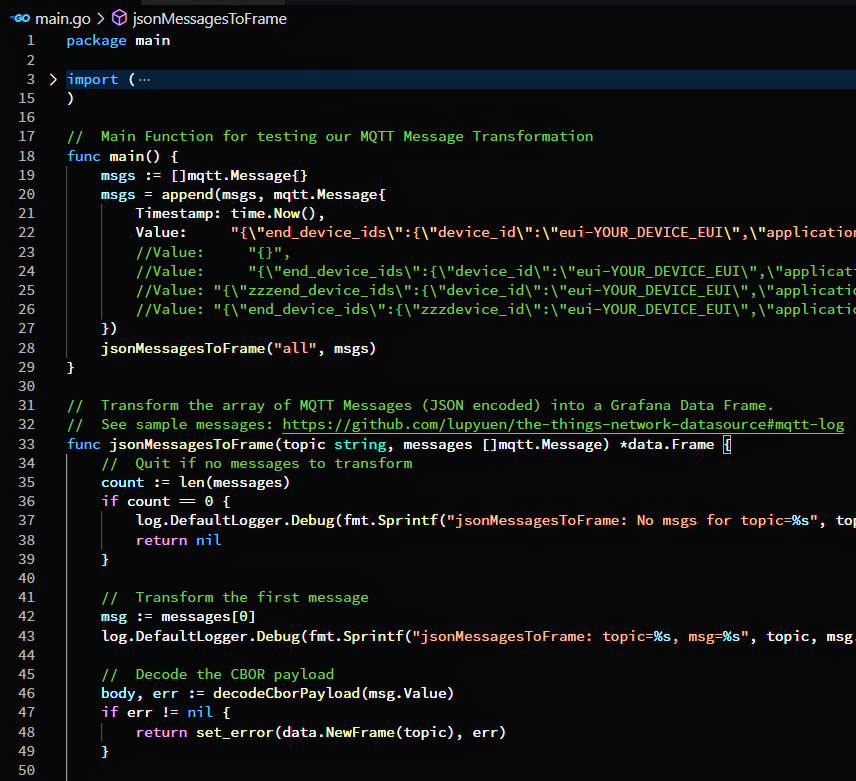
Our Data Source calls this function to transform the Received MQTT Message into a Grafana Data Frame: pkg/plugin/message.go
//  Transform the array of MQTT Messages (JSON encoded)
//  into a Grafana Data Frame.
func ToFrame(topic string, messages []mqtt.Message) *data.Frame {
  count := len(messages)
  if count > 0 {
    first := messages[0].Value

    //  JSON Message must begin with "{"
    if strings.HasPrefix(first, "{") {
      return jsonMessagesToFrame(topic, messages)
    }
  }
  //  Omitted: Handle non-JSON messages
The code above forwards the received messages (JSON format) to this function: pkg/plugin/message.go
//  Transform the array of MQTT Messages (JSON encoded)
//  into a Grafana Data Frame. See sample messages: https://github.com/lupyuen/the-things-network-datasource#mqtt-log
func jsonMessagesToFrame(topic string, messages []mqtt.Message) *data.Frame {
  //  Quit if no messages to transform
  count := len(messages)
  if count == 0 {
    return nil
  }

  //  Transform the first message
  msg := messages[0]

  //  Decode the CBOR payload
  body, err := decodeCborPayload(msg.Value)
  if err != nil {
    return set_error(data.NewFrame(topic), err)
  }
We begin by decoding the CBOR payload for the first message.
(More about this in the next chapter)
Next we construct the Timestamp Field…
  //  Construct the Timestamp field
  timeField := data.NewFieldFromFieldType(data.FieldTypeTime, count)
  timeField.Name = "Time"
  timeField.SetConcrete(0, msg.Timestamp)
We compose the Data Fields (like “t” and “l”) for the first message…
  //  Create a field for each key and set the first value
  keys := make([]string, 0, len(body))
  fields := make(map[string]*data.Field, len(body))

  //  Compose the fields for the first row of the Data Frame
  for key, val := range body {
    //  Get the Data Frame Type for the field
    typ := get_type(val)

    //  Create the field for the first row
    field := data.NewFieldFromFieldType(typ, count)
    field.Name = key
    field.SetConcrete(0, val)
    fields[key] = field
    keys = append(keys, key)
  }
  sort.Strings(keys) // keys stable field order.
(We’ll see “get_type” in the next chapter)
Now we do the same for the remaining messages…
  //  Transform the messages after the first one
  for row, m := range messages {
    //  Skip the first message
    if row == 0 {
      continue
    }

    //  Decode the CBOR payload
    body, err := decodeCborPayload(m.Value)
    if err != nil {  //  Ignore decode errors
      continue
    }

    //  Set the Timestamp for the transformed row
    timeField.SetConcrete(row, m.Timestamp)

    //  Set the fields for the transformed row
    for key, val := range body {
      field, ok := fields[key]
      if ok {
        field.SetConcrete(row, val)
      }
    }
  }
Finally we pack all the Data Fields into a Data Frame…
  //  Construct the Data Frame
  frame := data.NewFrame(topic, timeField)

  //  Append the fields to the Data Frame
  for _, key := range keys {
    frame.Fields = append(frame.Fields, fields[key])
  }
  return frame
}
And we return the transformed Data Frame to Grafana.
Transformation Complete!
How do we handle transformation errors?
We call this function to set the error on the Data Frame, and return it to Grafana: pkg/plugin/message.go
//  Return the Data Frame set to the given error
func set_error(frame *data.Frame, err error) *data.Frame {
  frame.AppendNotices(data.Notice{
    Severity: data.NoticeSeverityError,
    Text:     err.Error(),
  })
  log.DefaultLogger.Debug(err.Error())
  return frame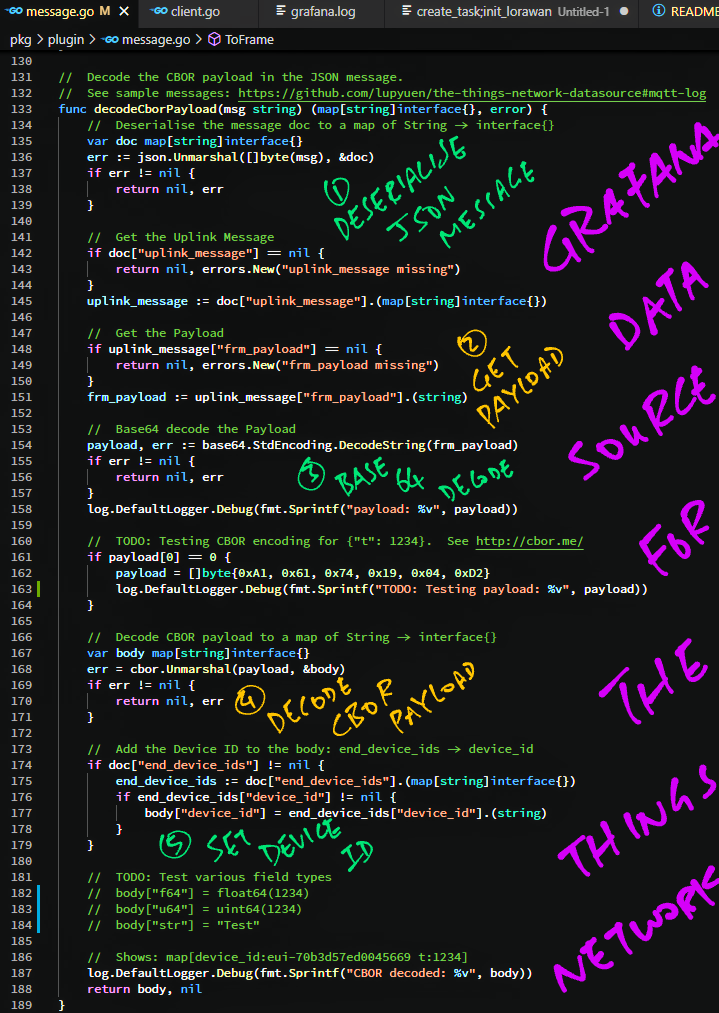
}We’ve seen the Message Transformation Logic, now we decode the CBOR payload in the MQTT Message: pkg/plugin/message.go
//  Decode the CBOR payload in the JSON message.
//  See sample messages: https://github.com/lupyuen/the-things-network-datasource#mqtt-log
func decodeCborPayload(msg string) (map[string]interface{}, error) {
  //  Deserialise the message doc to a map of string → interface{}
  var doc map[string]interface{}
  err := json.Unmarshal([]byte(msg), &doc)
  if err != nil {
    return nil, err
  }
We start by deserialising the JSON message.
Remember that our Message Payload is located at…
uplink_message → frm_payloadWe extract the Message Payload like so…
  //  Get the Uplink Message
  uplink_message, ok := doc["uplink_message"].(map[string]interface{})
  if !ok {
    return nil, errors.New("uplink_message missing")
  }

  //  Get the Payload
  frm_payload, ok := uplink_message["frm_payload"].(string)
  if !ok {
    return nil, errors.New("frm_payload missing")
  }
Message Payload is encoded with Base64, thus we decode it…
  //  Base64 decode the Payload
  payload, err := base64.StdEncoding.DecodeString(frm_payload)
  if err != nil {
    return nil, err
  }
Next we decode the CBOR payload…
  //  Decode CBOR payload to a map of String → interface{}
  var body map[string]interface{}
  err = cbor.Unmarshal(payload, &body)
  if err != nil {
    return nil, err
  }
(Yep we’ve seen this earlier)
To support filtering by Device ID, we extract the Device ID from the MQTT Message…
  //  Add the Device ID to the body: end_device_ids → device_id
  end_device_ids, ok := doc["end_device_ids"].(map[string]interface{})
  if ok {
    device_id, ok := end_device_ids["device_id"].(string)
    if ok {
      body["device_id"] = device_id
    }
  }
  return body, nil
}
Finally we return the decoded CBOR payload.
(Containing “t”, “l” and the Device ID)
Note that we need to specify the types of Data Fields when populating a Grafana Data Frame.
We call this function to map CBOR Types to Grafana Data Field Types: pkg/plugin/message.go
//  Return the Data Frame Type for the CBOR decoded value
func get_type(val interface{}) data.FieldType {
  //  Based on https://github.com/fxamacker/cbor/blob/master/decode.go#L43-L53
  switch v := val.(type) {
  //  CBOR booleans decode to bool.
  case bool:
    return data.FieldTypeBool

  //  CBOR positive integers decode to uint64.
  case uint64:
    return data.FieldTypeNullableUint64

  //  CBOR floating points decode to float64.
  case float64:
    return data.FieldTypeNullableFloat64

  //  CBOR text strings decode to string.
  case string:
return data.FieldTypeNullableStringTesting the MQTT Message Transformation looks painful!
Indeed. That’s why we wrote another Go program to test the transformation by calling jsonMessagesToFrame…
If we have problems with the Data Source, enabling Debug Logging might help.
Edit the Grafana Configuration File…
## For Linux:
/usr/share/grafana/conf/defaults.ini

## For macOS:
/usr/local/etc/grafana/grafana.ini

## For Windows:
C:\Program Files\GrafanaLabs\grafana\conf\defaults.ini
Set the Log Level…
[log]
level = debug
Save the file and restart the Grafana Server.
Check the Grafana Log at…
## For Linux:
/var/log/grafana/grafana.log

## For macOS:
/usr/local/var/log/grafana/grafana.log

## For Windows:
C:\Program Files\GrafanaLabs\grafana\data\log\grafana.logToday we have streamed Sensor Data from The Things Network to Grafana over MQTT…
Wait… We’re streaming the Sensor Data without storing it?
Yep this streaming setup for Grafana requires fewer components because it doesn’t store the data.
But this streaming setup has limitations…
What happens when we restart our Grafana Server?
All our Sensor Data is lost!
We’re remembering only the last 1,000 messages.
Which is OK for checking real-time Sensor Data transmitted by our devices…
But not OK for observing Sensor Data trends over time!
Can we store the Sensor Data?
We can store the Sensor Data in Prometheus, the open source Time-Series Data Store…
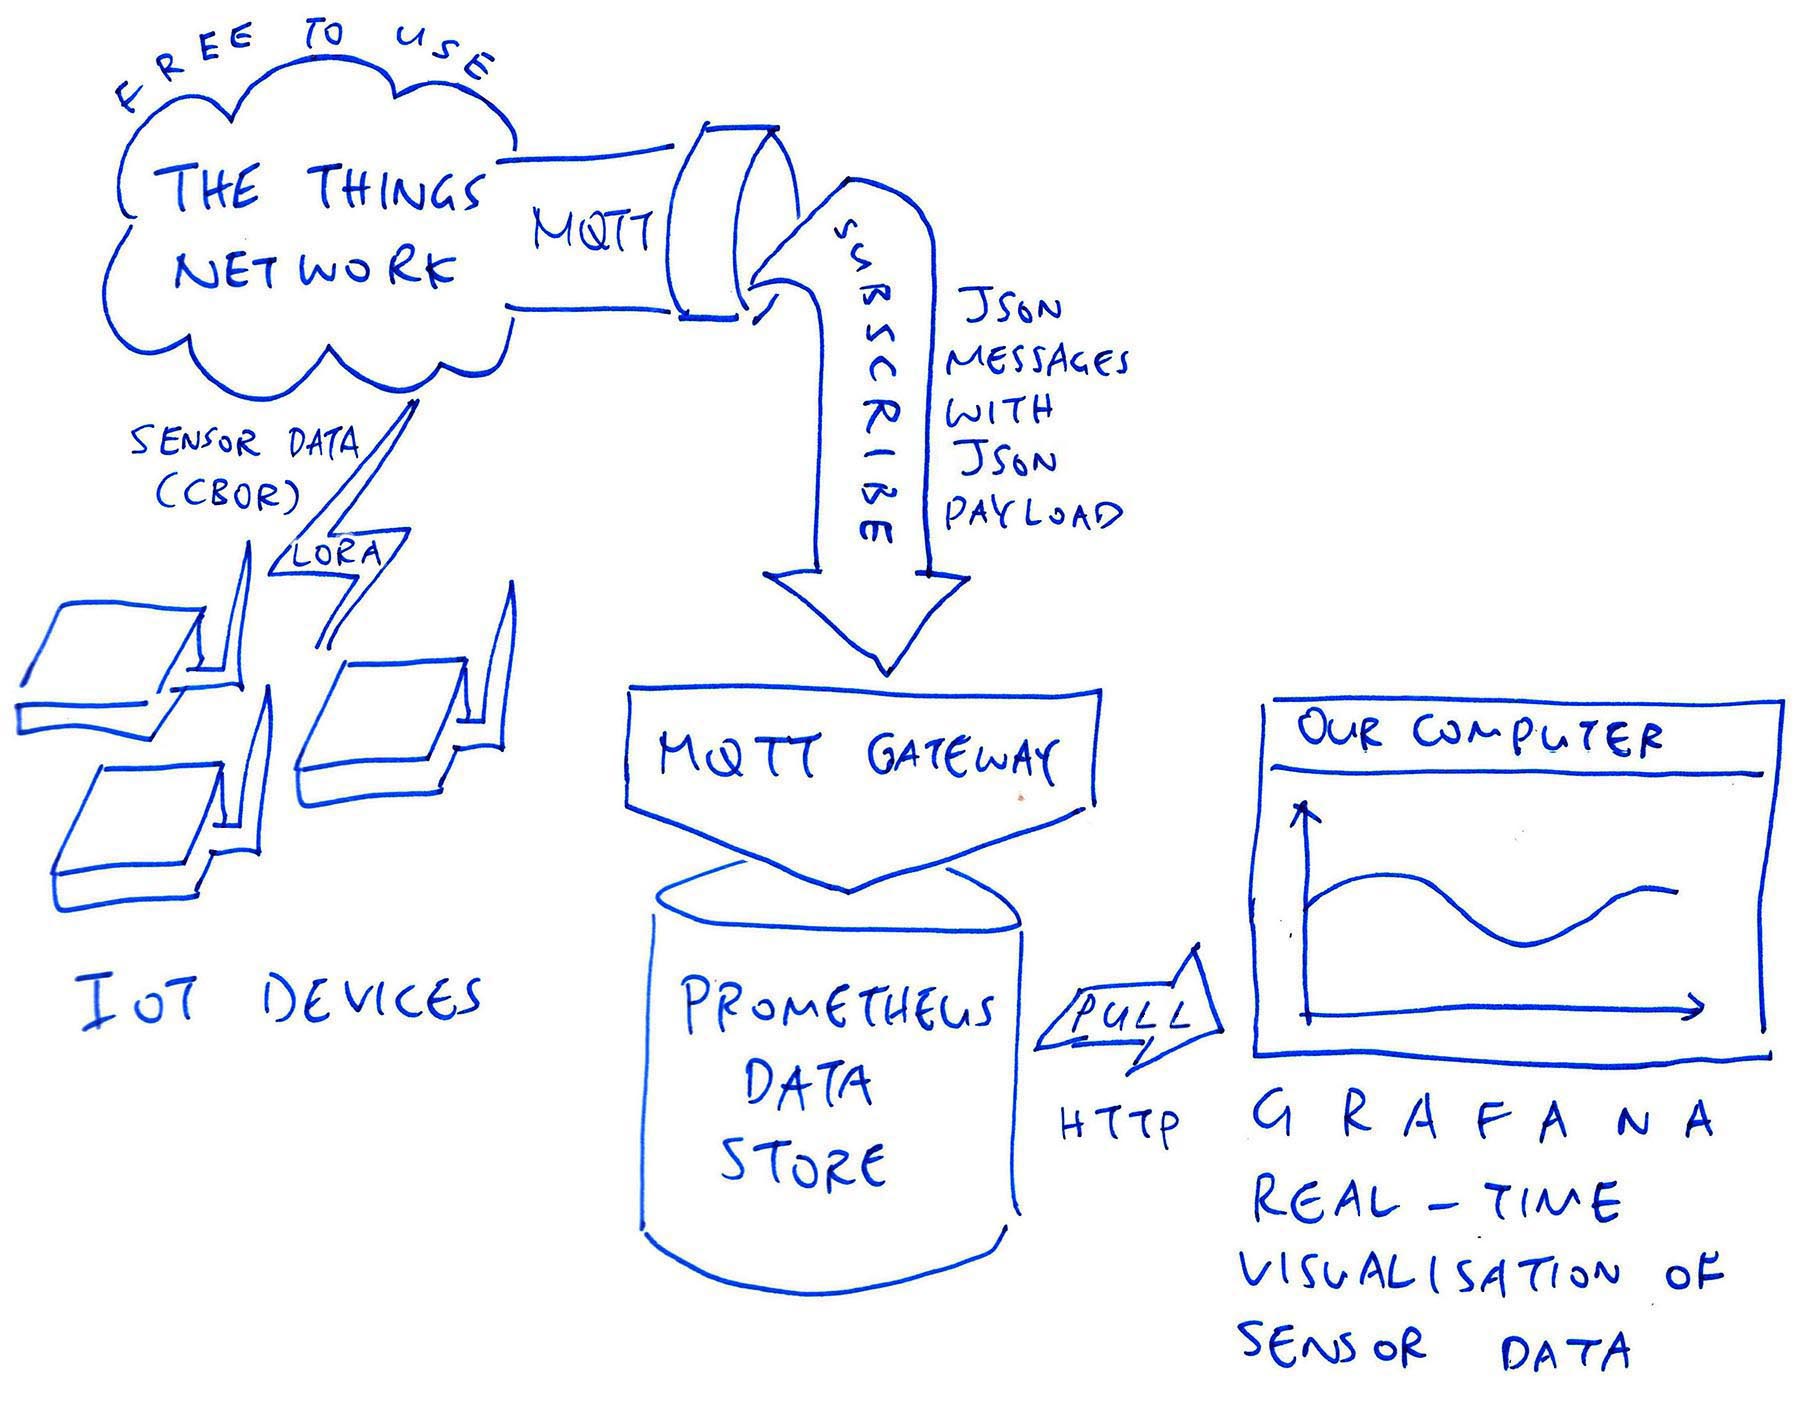
Grafana supports Prometheus as a Data Source, so pushing our Sensor Data from Prometheus to Grafana is easy.
To ingest MQTT Messages from The Things Network into Prometheus, we need an MQTT Gateway like this…
This Grafana setup looks more complicated, but it works well for visualising historical Sensor Data. See this…
More about this in the next chapter…
We’ve seen two ways of connecting Grafana to The Things Network…
Via Grafana Data Source for The Things Network
(As explained in this article)
Via Prometheus with an MQTT Gateway
How do they compare?
Well the approach described in this article has some serious shortcomings…
Fixed Payload Format: Only CBOR Payloads are supported
(Prometheus uses a configurable Payload Formatter that supports multiple payload formats)
Fixed MQTT Topic: Only one MQTT Topic is supported (“#”)
(Prometheus supports configurable MQTT Topics)
Fixed Fields: Only specific fields are extracted (Device ID and Sensor Data)
(Prometheus extracts multiple Metrics based on configurable JSON Paths)
No TLS Encryption: Our MQTT Password is transmitted in the clear
(Prometheus supports TLS Encryption for MQTT)
No Persistence: Our Sensor Data disappears when we restart Grafana Server
(Prometheus stores Sensor Data in a Time Series Database)
Custom Coding: Our Data Source requires custom coding. And it’s incomplete.
(Prometheus works without custom coding, except for the Custom Payload Formatter. And a minor patch for TLS Encryption)
Thus Prometheus is the recommended way to connect Grafana to The Things Network…
I hope you enjoyed our exploration today: Streaming Sensor Data from The Things Network to Grafana over MQTT.
In the next article we shall head back to PineDio Stack BL604 and transmit actual Sensor Data to The Things Network, encoded with CBOR.
Many Thanks to my GitHub Sponsors for supporting my work! This article wouldn’t have been possible without your support.
Got a question, comment or suggestion? Create an Issue or submit a Pull Request here…
lupyuen.github.io/src/grafana.md
This article is the expanded version of this Twitter Thread
What exactly are “t” and “l” in our Sensor Data?
{
  "t": 1234,
  "l": 2345
}“t” and “l” represent our (imaginary) Temperature Sensor and Light Sensor.
We shortened the Field Names to fit the Sensor Data into 11 bytes of CBOR.
With Grafana we can map “t” and “l” to their full names for display.
Why is the temperature transmitted as an integer: 1234?
That’s because floating-point numbers compress poorly with CBOR unless we select the proper encoding.
(Either 3 bytes, 5 bytes or 9 bytes per float. See the next note)
Instead we assume that our integer data has been scaled up 100 times.
(So 1234 actually means 12.34 ºC)
We may configure Grafana to divide our integer data by 100 when rendering the values.
If we’re actually encoding floats in CBOR, how do we select the proper encoding?
The CBOR spec says that there are 3 ways to encode floats…
IEEE 754 Half-Precision Float (16 bits)
(3.3 significant decimal digits)
IEEE 754 Single-Precision Float (32 bits)
(6 to 9 significant decimal digits)
IEEE 754 Double-Precision Float (64 bits)
(15 to 17 significant decimal digits)
What would be the proper encoding for a float (like 12.34) that could range from 0.00 to 99.99?
This means that we need 4 significant decimal digits.
Which is too many for a Half-Precision Float (16 bits), but OK for a Single-Precision Float (32 bits).
Thus we need 5 bytes to encode the float. (Including the CBOR Initial Byte)
(Thanks to @chrysn for highlighting this!)
Is it meaningful to record temperatures that are accurate to 0.01 ºC?
How much accuracy do we need for Sensor Data anyway?
The accuracy for our Sensor Data depends on…
Our monitoring requirements, and
Accuracy of our sensors
Learn more about Accuracy and Precision of Sensor Data…
It’s possible to decode CBOR in The Things Network servers with a Payload Formatter.
If we do this, we can skip the CBOR decoding in our Grafana Data Source. See this…
Here are the steps to install Grafana and our Data Source for The Things Network.
Browse to grafana.com/oss/grafana
Click “Get Grafana → Self-Managed → Download Grafana”
For “Edition” select “OSS”
Click Linux, macOS, Windows, Arm or Docker
(Grafana for Linux works on WSL too)
Follow the instructions to download and install Grafana
For Linux and macOS: Start the Grafana Server
## For Ubuntu and WSL
sudo service grafana-server restart
sudo service grafana-server status

## For macOS
brew services start grafana
To test Grafana, browse to
http://localhost:3000
Username: admin
Password: admin
(Note: Our Data Source uses the Grafana Live Streaming API, please use Grafana version 8.0 or later)
For Windows: Grant Full Control permission to the Users group for the Grafana Plugins Folder…
C:\Program Files\GrafanaLabs\grafana\data\plugins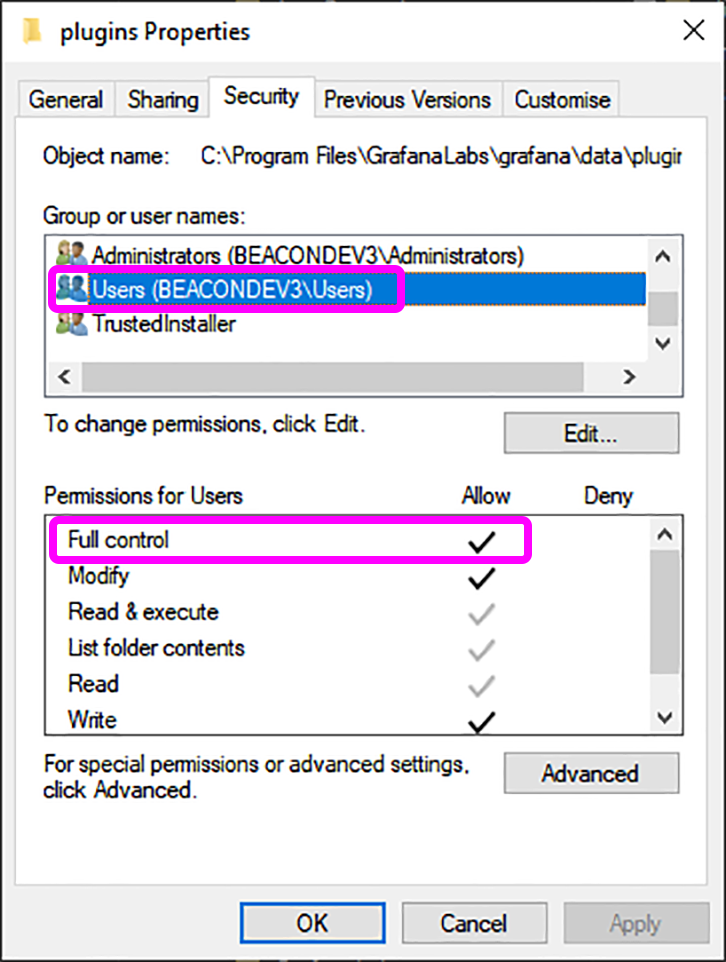
Download the Data Source into the Grafana Plugins Folder…
##  For Linux: Need "sudo" to access this folder
cd /var/lib/grafana/plugins

##  For macOS:
cd /usr/local/var/lib/grafana/plugins

##  For Windows: Need to grant "Full Control" permission to "Users" group for this folder
cd C:\Program Files\GrafanaLabs\grafana\data\plugins

##  Download source files for The Things Network Data Source
git clone --recursive https://github.com/lupyuen/the-things-network-datasource
Install the Build Tools…
Build the Data Source…
##  Install the dependencies
cd the-things-network-datasource
yarn install

##  Build the Data Source (React + Go)
yarn build

##  If "mage" is not found, set the PATH
export PATH=$PATH:$GOPATH/binIf “yarn build” fails on Windows, edit package.json and replace “rm -rf” by “rimraf”
Restart the Grafana Service for the Data Source to load
## For Ubuntu and WSL:
sudo service grafana-server restart
sudo service grafana-server status

## For macOS:
brew services restart grafana

## For Windows: Run this as Administrator
net stop grafana
net start grafanaEdit the Grafana Configuration File…
## For Linux:
/usr/share/grafana/conf/defaults.ini

## For macOS:
/usr/local/etc/grafana/grafana.ini

## For Windows:
C:\Program Files\GrafanaLabs\grafana\conf\defaults.ini
To enable our Data Source, set…
[plugins]
allow_loading_unsigned_plugins = the-things-network-datasource
To enable Debug Logs, set…
[log]
level = debug
Restart the Grafana Service for the Data Source to load
## For Ubuntu and WSL:
sudo service grafana-server restart
sudo service grafana-server status

## For macOS:
brew services restart grafana

## For Windows: Run this as Administrator
net stop grafana
net start grafana
In case of problems, check the Grafana Log at…
## For Linux:
/var/log/grafana/grafana.log

## For macOS:
/usr/local/var/log/grafana/grafana.log

## For Windows:
C:\Program Files\GrafanaLabs\grafana\data\log\grafana.logTo install the tools for building our Grafana Data Source on macOS…
Install Node.js v14 or later…
Install Yarn…
npm install -g yarnInstall Go…
Install Mage…
go get -u -d github.com/magefile/mage
pushd $GOPATH/src/github.com/magefile/mage
go run bootstrap.go
export PATH=$PATH:$GOPATH/bin
mage -version
popd