Debugging PineCone BL602 RISC-V Evaluation Board with Sipeed JTAG Debugger
📝 14 Dec 2020
Earlier we took a quick peek at PineCone BL602 RISC-V Evaluation Board…
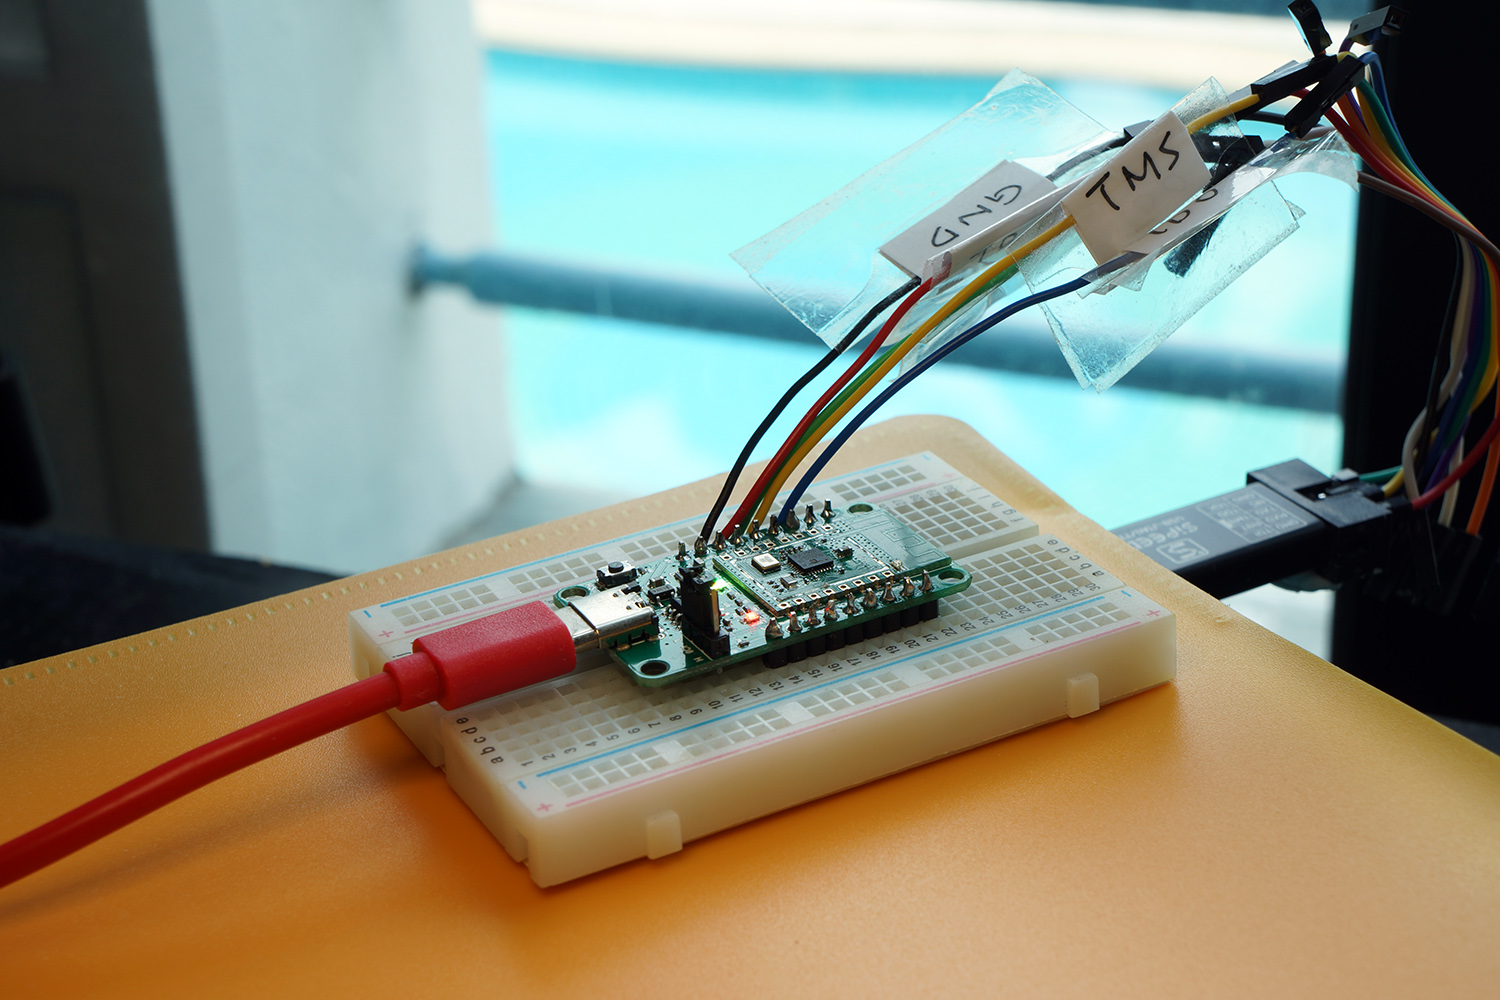
Then we connected PineCone to OpenOCD with a JTAG Debugger…
Today we’ll learn to build and debug Rust Firmware for PineCone in two ways…
With the GDB Debugger (text-based)
With the VSCode Debugger (graphical-based)
The instructions here should work on Linux, macOS and Windows.
UPDATE: We have a new way to create Rust Firmware with BL602 IoT SDK, check this out
Watch the Sneak Peek on YouTube
Note: There’s a new doc on BL602, OpenOCD and GDB. Check it out here
Follow the instructions in the article…
“Connect PineCone BL602 to OpenOCD”
Section 4: “Connect JTAG Debugger to PineCone”
Section 5: “Download and run OpenOCD”
Remember to download bl602-pac and bl602-hal
Use the Default JTAG Port on PineCone (Without remapping)
Copy the extracted xPack OpenOCD folder to the pinecone-rust folder
Rename it as…
pinecone-rust/xpack-openocdInstall Rust with support for nightly target riscv32imac-unknown-none-elf….
Browse to rustup.rs
Follow the instructions to install rustup
Press Enter to select…
1) Proceed with installation (default)For Linux and macOS: Open a command prompt and enter…
source $HOME/.cargo/env
rustup update
rustup default nightly
rustup target add riscv32imac-unknown-none-elf
For Windows: Enter the above commands in a Windows Command Prompt (not WSL Terminal). Omit the source line.
Now we install xPack GCC for RISC-V, which contains the GDB Debugger…
Download GCC from the xPack GCC for RISC-V site…
Extract the downloaded archive.
On Windows: Use 7-Zip
Copy the extracted xPack GCC RISC-V folder to the pinecone-rust folder.
Rename the folder as…
pinecone-rust/xpack-riscv-none-embed-gccCreate a symbolic link for the GDB executable, so that Rust can find it…
For Linux and macOS:
cd pinecone-rust
ln -s "$PWD/xpack-riscv-none-embed-gcc/bin/riscv-none-embed-gdb" "$PWD/xpack-riscv-none-embed-gcc/bin/riscv64-unknown-elf-gdb"
For Windows:
In File Explorer, open the folder…
pinecone-rust\xpack-riscv-none-embed-gcc\binCopy and paste the file riscv-none-embed-gdb.exe
Rename the copied file as riscv64-unknown-elf-gdb.exe
Go to Windows Settings and add to PATH the full pathname of the above folder, which will look like this…
c:\pinecone-rust\xpack-riscv-none-embed-gcc\binChange c:\pinecone-rust to the location of the pinecone-rust folder.
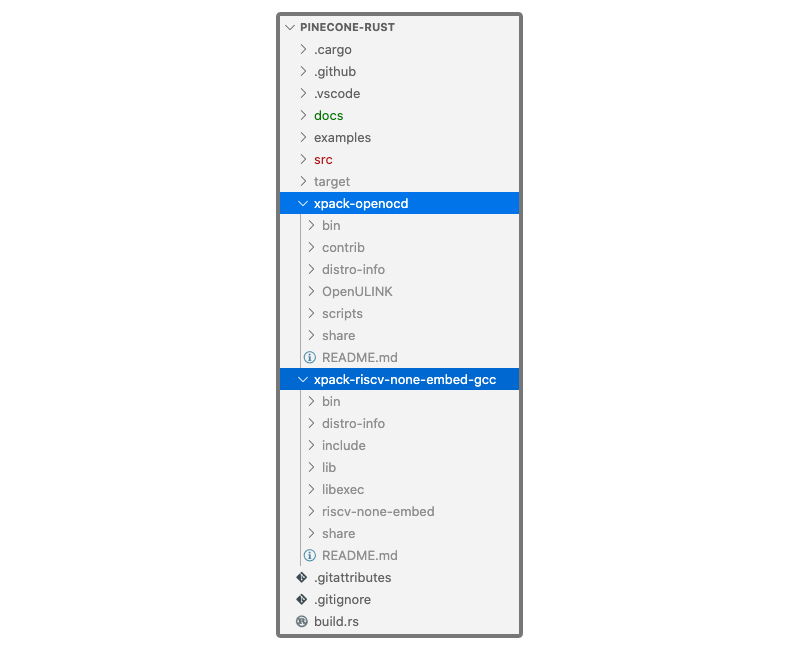
After installing OpenOCD, Rust and GDB, the pinecone-rust folder should look like this…
Let’s build the Rust Firmware…
cd pinecone-rust
cargo build
We should see…
   Compiling autocfg v1.0.1
   Compiling memchr v2.3.4
   Compiling lazy_static v1.4.0
   Compiling regex-syntax v0.6.21
   Compiling semver-parser v0.7.0
   Compiling proc-macro2 v0.4.30
   Compiling unicode-xid v0.1.0
   Compiling rand_core v0.4.2
   Compiling syn v0.15.44
   Compiling bit_field v0.10.1
   Compiling bl602-pac v0.1.0 (/Users/Luppy/pinecone/bl602-pac)
   Compiling bare-metal v1.0.0
   Compiling nb v1.0.0
   Compiling vcell v0.1.2
   Compiling bl602-rust-guide v0.1.0 (/Users/Luppy/pinecone/pinecone-rust)
   Compiling paste v1.0.4
   Compiling r0 v1.0.0
   Compiling panic-halt v0.2.0
   Compiling thread_local v1.0.1
   Compiling rand_core v0.3.1
   Compiling semver v0.9.0
   Compiling embedded-hal v1.0.0-alpha.4 (https://github.com/rust-embedded/embedded-hal#eae6c995)
   Compiling rand v0.5.6
   Compiling num-traits v0.2.14
   Compiling num-integer v0.1.44
   Compiling num-iter v0.1.42
   Compiling num-rational v0.3.2
   Compiling rustc_version v0.2.3
   Compiling aho-corasick v0.7.15
   Compiling bare-metal v0.2.5
   Compiling quote v0.6.13
   Compiling num-complex v0.3.1
   Compiling num v0.3.1
   Compiling embedded-time v0.10.1 (https://github.com/FluenTech/embedded-time#12e78c34)
   Compiling regex v1.4.2
   Compiling riscv-target v0.1.2
   Compiling riscv v0.6.0
   Compiling riscv-rt v0.8.0
   Compiling riscv-rt-macros v0.1.6
   Compiling bl602-hal v0.1.0 (/Users/Luppy/pinecone/bl602-hal)
Ignore these warnings… We’ll cover them in a while.
warning: unused imports: `clock::Strict`, `serial::*`
 --> src/main.rs:4:17
  |
4 | use bl602_hal::{serial::*, pac, prelude::*, clock::Strict};
  |                 ^^^^^^^^^                   ^^^^^^^^^^^^^
  |
  = note: `#[warn(unused_imports)]` on by default

warning: unused variable: `parts`
  --> src/main.rs:11:9
   |
11 |     let mut parts = dp.GLB.split();
   |         ^^^^^^^^^ help: if this is intentional, prefix it with an underscore: `_parts`
   |
   = note: `#[warn(unused_variables)]` on by default

warning: variable does not need to be mutable
  --> src/main.rs:11:9
   |
11 |     let mut parts = dp.GLB.split();
   |         ----^^^^^
   |         |
   |         help: remove this `mut`
   |
   = note: `#[warn(unused_mut)]` on by default

warning: 3 warnings emitted

    Finished dev [unoptimized + debuginfo] target(s) in 1m 17s
This creates the RISC-V ELF Firmware image for PineCone…
pinecone-rust/target/riscv32imac-unknown-none-elf/debug/bl602-rust-guideIs Rust Firmware any different from the C Firmware that we have seen earlier?
From the Memory Map below, we can see that…
C Firmware runs in the XIP Flash Memory Region at 0x2300 0000
(XIP means Execute In Place… The firmware code is executed directly from BL602’s Internal Flash Memory, without copying to RAM)
Rust Firmware runs in the Instruction Cache Memory Region at 0x2200 8000
Which is similar to RAM. And probably works better for debugging.
(The Build Settings for the Rust Firmware were kindly provided by the Sipeed BL602 Community)
In the next section we shall use the GDB Debugger to load our Rust Firmware into the cache memory for debugging.
Can we flash Rust Firmware with blflash and other UART flashing tools?
Nope, blflash and other UART flashing tools will not load Rust Firmware into Cache Memory. They will load firmware only to Flash Memory.
We need a JTAG Debugger for loading Rust Firmware into Cache Memory.
More about BL602 Cache Memory vs Flash Memory
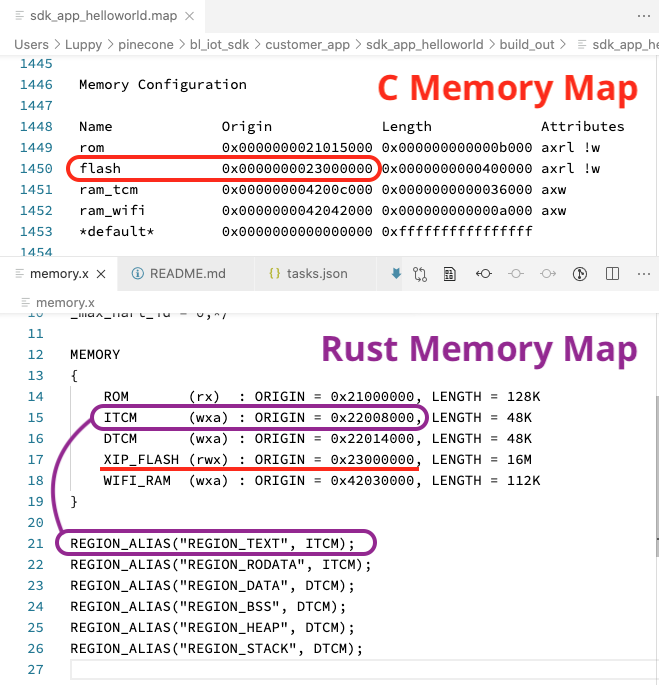
Memory Map of PineCone Firmware: C vs Rust
(If you’re interested only in VSCode debugging, skip to the next section)
Let’s run the Rust Firmware and debug it with GDB. We’ll need two command prompts: One for OpenOCD and another for GDB.
At the command prompt, enter…
cd pinecone-rust
xpack-openocd/bin/openocd
For Windows: Enter…
cd pinecone-rust
xpack-openocd\bin\openocd
We should see OpenOCD connecting to PineCone…
xPack OpenOCD, x86_64 Open On-Chip Debugger 0.10.0+dev-00378-ge5be992df (2020-06-26-12:31)
Licensed under GNU GPL v2
For bug reports, read
        http://openocd.org/doc/doxygen/bugs.html
Ready for Remote Connections
Info : clock speed 100 kHz
Info : JTAG tap: riscv.cpu tap/device found: 0x20000c05 (mfg: 0x602 (<unknown>), part: 0x0000, ver: 0x2)
Info : datacount=1 progbufsize=2
Info : Disabling abstract command reads from CSRs.
Info : Examined RISC-V core; found 1 harts
Info :  hart 0: XLEN=32, misa=0x40801125
Info : starting gdb server for riscv.cpu.0 on 3333
Info : Listening on port 3333 for gdb connections
Info : JTAG tap: riscv.cpu tap/device found: 0x20000c05 (mfg: 0x602 (<unknown>), part: 0x0000, ver: 0x2)
reset-assert-pre
reset-deassert-post
Info : Disabling abstract command writes to CSRs.
reset-init
Info : Listening on port 6666 for tcl connections
Info : Listening on port 4444 for telnet connections
Keep OpenOCD running as we start GDB…
Open another command prompt. Enter…
cd pinecone-rust
export PATH="$PWD/xpack-riscv-none-embed-gcc/bin:$PATH"
cargo run
For Windows: Omit the line export PATH
We should see…
    Finished dev [unoptimized + debuginfo] target(s) in 0.08s
     Running `riscv64-unknown-elf-gdb -q -x openocd.gdb target/riscv32imac-unknown-none-elf/debug/bl602-rust-guide`
Reading symbols from target/riscv32imac-unknown-none-elf/debug/bl602-rust-guide...
0x21000000 in ?? ()
Loading section .text, size 0x22b0 lma 0x22008000
Loading section .rodata, size 0x5d8 lma 0x2200a2b0
Start address 0x22008000, load size 10376
Transfer rate: 2 KB/sec, 5188 bytes/write.
GDB has loaded our Rust Firmware into PineCone’s cache memory. PineCone starts running our firmware…
Breakpoint 1 at 0x22008000: file asm.S, line 27.

Breakpoint 1, _start () at asm.S:27
27      asm.S: No such file or directory.
GDB has paused the firmware execution at a Breakpoint in our code. (We’ll see this Breakpoint shortly)
At the GDB prompt, enter…
break main
continue
This tells GDB to set a Breakpoint at the main function in Rust. And continue execution until we hit the Breakpoint.
We’ll see…
(gdb) break main
Breakpoint 2 at 0x2200924e: file src/main.rs, line 10.
(gdb) continue
Continuing.

Breakpoint 2, main () at src/main.rs:10
10          let dp = pac::Peripherals::take().unwrap();
GDB has paused execution at the main function in Rust.
Enter next to resume execution until the next line…
(gdb) next
11          let mut parts = dp.GLB.split();
(gdb) bt
#0  main () at src/main.rs:11
The bt command shows us the Stack Trace and local variables.
Yep we’re now debugging our Rust Firmware with GDB! Check out the GDB docs for more debugging commands…
In OpenOCD we’ll see this warning… Just ignore it
Info : accepting 'gdb' connection on tcp/3333
Info : Disabling abstract command reads from FPRs.
Warn : negative reply, retrying
Warn : negative acknowledgment, but no packet pendingWhat’s driving GDB? How does GDB know how to do the things that it did?
That’s the purpose of the GDB Script. Let’s look inside openocd.gdb…
GDB doesn’t talk to PineCone natively… But GDB can talk to PineCone through OpenOCD.
This command tells GDB to talk to OpenOCD through the TCP port localhost:3333…
target extended-remote :3333The Rust Compiler will mangle up most function names. The function name riscv::interrupt::enable becomes this…
_ZN5riscv9interrupt6enable17ha2fdcd71882d698eEHere’s how we display the dismangled function names…
# Print demangled symbols
set print asm-demangle on
We set a Backtrace Limit that we don’t get stuck in a loop while displaying the Stack Trace (the bt command)…
# Set backtrace limit to not have infinite backtrace loops
set backtrace limit 32
We tell GDB about the Memory Regions on BL602, and whether they are Read-Write (rw) or Read-Only (ro)…
mem 0x22008000 0x22014000 rw
mem 0x42008000 0x42014000 rw
mem 0x22014000 0x22020000 rw
mem 0x42014000 0x42020000 rw
mem 0x22020000 0x22030000 rw
mem 0x42020000 0x42030000 rw
mem 0x22030000 0x2204C000 rw
mem 0x42030000 0x4204C000 rw
mem 0x23000000 0x23400000 ro
Refer to BL602 Reference Manual, Section 1.3 “Function Description”, Pages 17 to 19.
We load the Rust Firmware into BL602’s Instruction Cache Memory…
loadWe create a Breakpoint at the function _start. This function is the first thing that runs when we start the firmware…
break _startFinally we step into the first RISC-V instruction in our firmware… And pause the execution
# Start the process but immediately halt the processor
stepiHow is the Rust Tool cargo configured to launch GDB?
cargo is configured through .cargo/config.toml…
[target.riscv32imac-unknown-none-elf]
rustflags = [
  "-C", "link-arg=-Tmemory.x",
  "-C", "link-arg=-Tlink.x",
]
runner = "riscv64-unknown-elf-gdb -q -x openocd.gdb"
## runner = "riscv32-unknown-elf-gdb -q -x openocd.gdb"

[build]
target = "riscv32imac-unknown-none-elf"
We see that cargo has been configured to launch riscv64-unknown-elf-gdb with the GDB Script openocd.gdb. The GDB Script loads our Rust Firmware to PineCone and starts debugging.
Also, cargo has been configured to produce Rust Firmware that uses the Memory Map Layout specified by memory.x.
What about the OpenOCD Script?
The OpenOCD Script openocd.cfg has been covered in our previous article…
openocd.gdb and openocd.cfg were graciously provided by the Sipeed BL602 Community
Before we talk about VSCode Debugging, let’s study the Source Code for our Rust Firmware: src/main.rs
#[riscv_rt::entry]
fn main() -> ! {
    let dp = pac::Peripherals::take().unwrap();
    let mut parts = dp.GLB.split();
    ...
    //  Loop forever
    loop {}
}
Even folks who have mastered Rust will find Embedded Rust a little strange… Let’s zoom into the code, line by line.
At the top we have a Rust Attribute that declares the Entry Function for our RISC-V firmware…
#[riscv_rt::entry]Followed by the declaration of our Entry Function main…
fn main() -> ! {This means that our Rust Function main will be called when the firmware starts, after initialising the registers and RAM. (More details)
(The return type “-> !” means that the function will loop forever, never returning)
Our BL602 Microcontroller supports multiple Peripheral Functions: Timer, UART, I2C, SPI, PWM, …
Here’s how we fetch the Peripheral Registers that control the Peripheral Functions…
let dp = pac::Peripherals::take().unwrap();pac refers to the Peripheral Access Crate for BL602. It exposes Peripherals, the Peripheral Registers for BL602.
Why the take and unwrap?
Rust is known for its Code Safety in Systems Programming.
take + unwrap is a common pattern in Embedded Rust to ensure that we access the Hardware Registers safely.
BL602’s Global Register (GLB) controls the global settings of the Bl602 Microcontroller.
It provides settings for Clock Management, Reset Management, Bus Management, Memory Management and GPIO Management.
We fetch the Global Register (and its components) from the Peripheral Registers like so…
let mut parts = dp.GLB.split();Our firmware should never terminate… It should loop forever handling events.
For now we’ll use an empty loop…
//  Loop forever
loop {}Where’s the rest of the Rust code?
This program was originally created for Sipeed’s BL602 Board… But some parts don’t work on PineCone and have been commented out. (Hence the compiler warnings)
We’ll discuss this mystery in a while.
GDB Debugging feels One Dimensional… An endless stream of text. Fortunately we got Two Dimensional graphical debugging: VSCode!
Launch VSCode
Click File → Open
Select the folder pinecone-rust
Click Terminal → Run Build Task
This builds the Rust Firmware. The RISC-V ELF Firmware image is generated here…
pinecone-rust/target/riscv32imac-unknown-none-elf/debug/bl602-rust-guideThis step also terminates any OpenOCD processes that are running. (Linux and macOS only)
Click Run → Start Debugging
The debugger loads our Rust Firmware to PineCone’s Cache Memory and begins execution.
Click View → Debug Console to view the Debug Console. GDB messages will be shown here.
The debugger pauses execution at the first line of the main function
We should see the screen below…
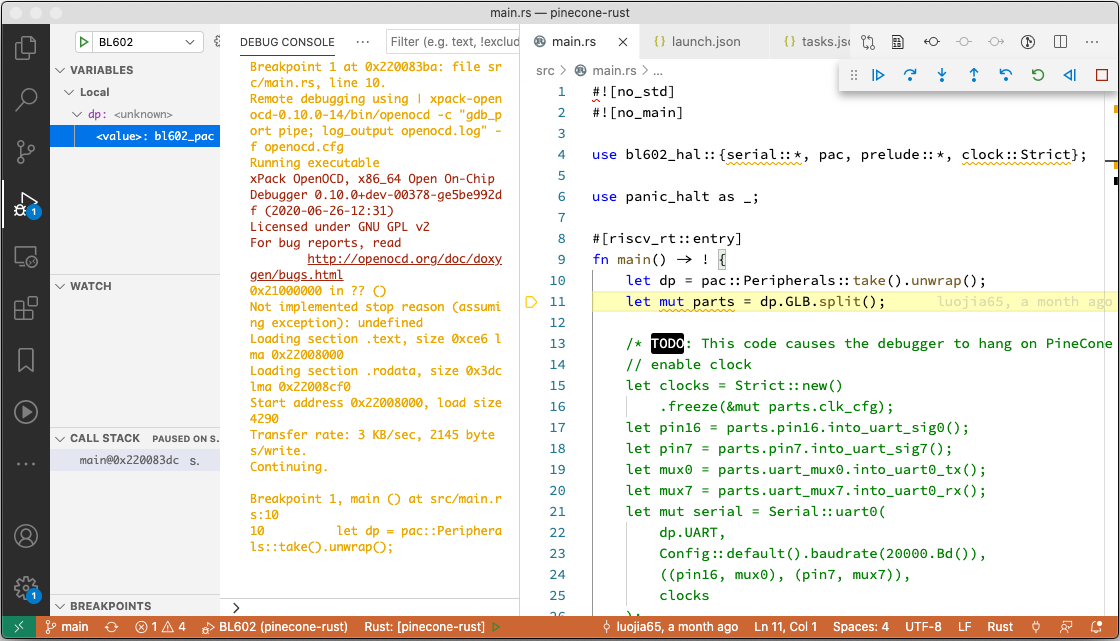
VSCode Debugger with Rust Firmware for PineCone BL602
We may use these features for debugging our Rust Firmware…
Variables (Left Top Pane): Inspect global and local variables
Watch (Left Centre): Show the value of expressions
Call Stack (Left Bottom): Navigate the stack trace and its variables
Debug Console (Centre): Enter GDB commands here
Debug Toolbar (Top Right): Continue / Pause, Step Over, Step Into, Step Out, Restart, Stop
To set a Breakpoint, click the Gutter Column at the left of the source code
When we’re done with debugging, click the Stop button in the Debug Toolbar at top right
Before we start a new debugging session with Run → Start Debugging…
We must always click Terminal → Run Build Task first!
That’s because stopping the debugger will leave OpenOCD running (and locking up the connection to PineCone).
Clicking Run Build Task will terminate the OpenOCD task, so that the next debugging session can restart OpenOCD successfully.
For Windows: Sorry we need to terminate the OpenOCD task manually with the Task Manager.
In case of OpenOCD problems, check the OpenOCD log file…
pinecone-rust/openocd.logFor details on the VSCode settings, check the section “Appendix: VSCode Settings” below.
Earlier we talked about some parts of the Rust Firmware code that don’t work on PineCone. (Because the code was created for Sipeed’s BL602 Board)
Let’s look at the sus parts: src/main.rs
// Enable clock
let clocks = Strict::new()
    .freeze(&mut parts.clk_cfg);
let pin16 = parts.pin16.into_uart_sig0();
let pin7 = parts.pin7.into_uart_sig7();
let mux0 = parts.uart_mux0.into_uart0_tx();
let mux7 = parts.uart_mux7.into_uart0_rx();
This code seems to be remapping pins IO 7 and IO 16 to UART Port 0. (Because BL602 allows us to remap any IO Pin to any Peripheral Function)
See BL602 Reference Manual, Section 3.2.8 “GPIO Function”, Page 27
let mut serial = Serial::uart0(
    dp.UART,
    Config::default().baudrate(20000.Bd()),
    ((pin16, mux0), (pin7, mux7)),
    clocks
);
This code creates a Serial Interface based on UART Port 0 with the remapped pins.
Serial is defined in the BL602 Hardware Abstraction Layer
loop {
    serial.try_write(b'R').ok();
    serial.try_flush().ok();
    serial.try_write(b'U').ok();
    serial.try_flush().ok();
    serial.try_write(b'S').ok();
    serial.try_flush().ok();
    serial.try_write(b'T').ok();
    serial.try_flush().ok();
}
This code loops forever, writing the characters RUST to the Serial Interface.
What happens when we run the above code on PineCone?
The GDB Debugger shows an error while executing the UART remapping code above. The code seems to terminate JTAG debugging connection, not sure why.
If there are any Brave Souls out there… Please rebuild the firmware with these chunks of code uncommented, step through with the debugger, and tell us what went wrong!
UPDATE: Check out this Rust Firmware that runs in XIP Flash Memory instead of Cache Memory
The Sipeed BL602 Community has provided two more Rust Demos…
GPIO Blinky Demo: examples/bl602-gpio-blinky.rs
Serial Demo: examples/bl602-serial.rs
But they won’t work on PineCone due to the board differences. Thus we need to create our own Rust Demos for PineCone…
Perhaps blinking the onboard RGB LED through the PWM Port?
Note that PineCone’s LED is connected to the same pins as the JTAG Port… So we need to remap the JTAG Port to other pins. (Which may complicate the debugging)
Can YOU create a Rust Demo that blinks PineCone’s RGB LED via PWM?
Please submit a Pull Request! Thank you 🙏
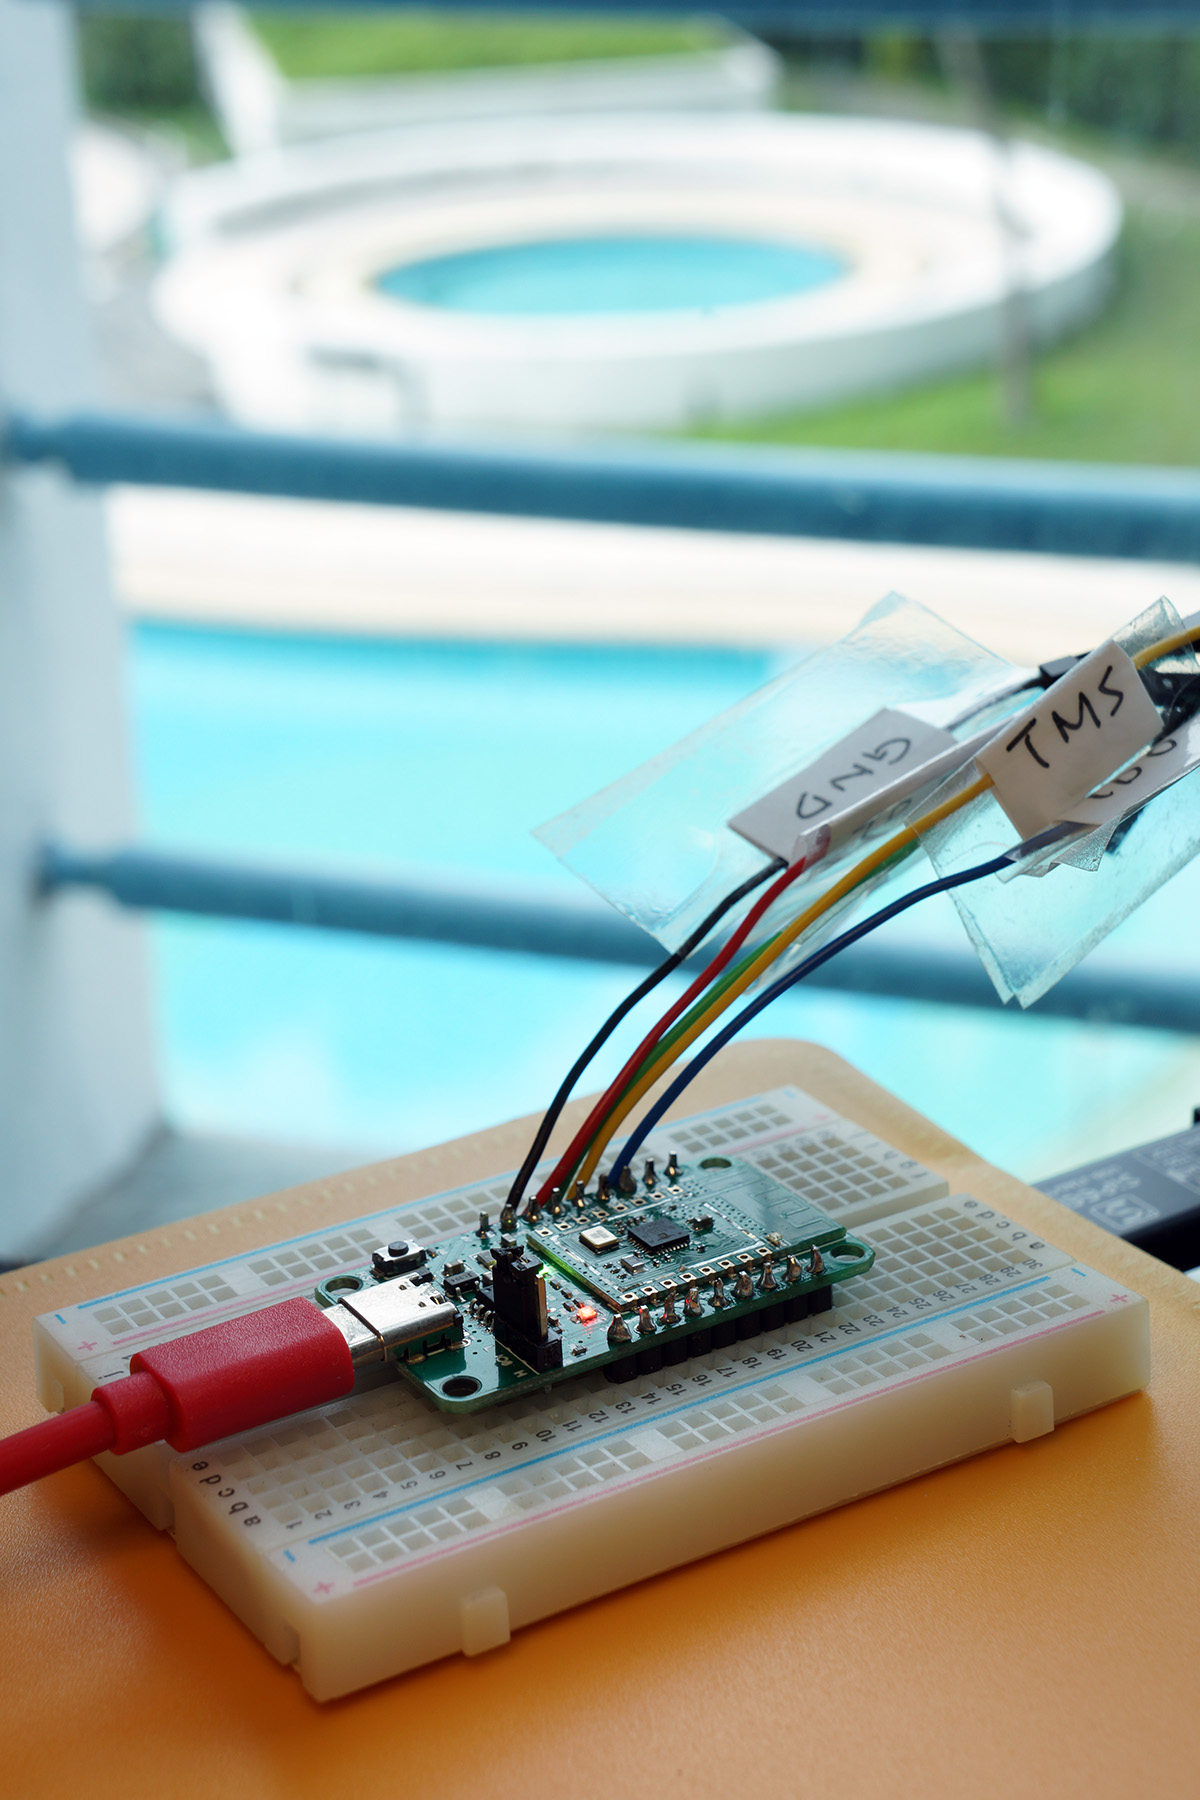
Poolside Debugging with PineCone BL602 RISC-V Evaluation Board
Now that we have GDB and VSCode Debuggers working with Rust Firmware on PineCone… It’s time for me to start something that I care deeply about…
Porting Apache Mynewt RTOS to PineCone
And yes it shall support Rust too!
Read about it here…
Got a question, comment or suggestion? Create an Issue or submit a Pull Request here…
lupyuen.github.io/src/debug.md
The VSCode Debugger Settings may be found in .vscode/launch.json
This file defines…
Firmware Path (target)
GDB Path (gdbpath)
OpenOCD Path (in autorun, after target remote)
{
    //  VSCode Debugger Config for PineCone BL602
    "version": "0.2.0",
    "configurations": [
        {
            "name": "BL602",
            "type": "gdb",
            "request": "launch",
            //  Application Executable to be flashed before debugging
            "target": "${workspaceRoot}/target/riscv32imac-unknown-none-elf/debug/bl602-rust-guide",
            "cwd": "${workspaceRoot}",
            "gdbpath": "${workspaceRoot}/xpack-riscv-none-embed-gcc/bin/riscv-none-embed-gdb",
            "valuesFormatting": "parseText",
            "autorun": [
                //  Before loading the Application, run these gdb commands.
                //  Set timeout for executing openocd commands.
                "set remotetimeout 600",

                //  This indicates that an unrecognized breakpoint location should automatically result in a pending breakpoint being created.
                "set breakpoint pending on",

                //  Set breakpoints
                "break main",  //  Break at main()

                //  Launch OpenOCD. Based on https://www.justinmklam.com/posts/2017/10/vscode-debugger-setup/
                "target remote | xpack-openocd/bin/openocd -c \"gdb_port pipe; log_output openocd.log\" -f openocd.cfg ",

                //  Load the program into cache memory
                "load",

                //  Run the program until we hit the main() breakpoint
                "continue",
            ]
        }
    ]
}The VSCode Task Settings may be found in .vscode/tasks.json
This file defines the VSCode Task for building the Rust Firmware…
{
    "version": "2.0.0",
    "tasks": [
        {
            //  Build firmware
            "label": "Build Firmware",
            "type": "shell",
            "windows": {
                "command": "cmd",
                "args": [
                    "/c",
                    " cargo build && echo ✅ ◾ ️Done! "
                ]
            },
            "osx": {
                "command": "bash",
                "args": [
                    "-c", "-l",
                    " pkill openocd ; set -e -x ; cargo build ; echo ✅ ◾ ️Done! "
                ]
            },
            "linux": {
                "command": "bash",
                "args": [
                    "-c", "-l",
                    " pkill openocd ; set -e -x ; cargo build ; echo ✅ ◾ ️Done! "
                ]
            },
            "group": {
                "kind": "build",
                "isDefault": true
            },
            "problemMatcher": [
                {
                    //  Problem matcher for GNU Linker, e.g. /Users/Luppy/mynewt/stm32bluepill-mynewt-sensor/apps/my_sensor_app/src/ATParser.h:82: undefined reference to `operator delete[](void*)'
                    "fileLocation": [ "absolute" ],
                    "pattern": {
                        "regexp": "^(/.*):(\\d+):\\s+(.*)$",
                        "file": 1,
                        "line": 2,
                        "message": 3,
                        // "code": 3,
                        // "severity": 4,
                    }
                }
            ],
            "presentation": {
                "clear": true
            }
        },
        ...