📝 5 Mar 2023
Clickable Call Graph for Apache NuttX RTOS
Last week we ran Apache NuttX Real-Time Operating System (RTOS) on Unicorn Emulator…
And we hit a baffling Arm64 Exception in the Unicorn Emulator while booting NuttX.
In this article we’ll create some tools to troubleshoot the Arm64 Exception in NuttX…
Render the Dynamic Call Graph for Apache NuttX RTOS, to understand how it boots (pic above)
Make it Clickable, so we can browse the NuttX Source Code as we explore the Call Graph
We’ll use a Block Execution Hook in Unicorn Emulator to generate the Call Graph with Rust
And call the Rust Libraries addr2line and gimli to map the Code Addresses to NuttX Kernel Functions
Thanks to the (Clickable) Call Graph, we’ll describe the complete Boot Sequence of NuttX RTOS on Pine64 PinePhone
And explain how we might do Automated Daily Build and Test for NuttX on PinePhone
CPU Emulators (like Unicorn) can be super helpful for understanding the internals of complex embedded programs… Like Apache NuttX RTOS!
Let’s dive in and learn how…
Running Apache NuttX RTOS in Unicorn
What’s Unicorn? How does it work with Apache NuttX RTOS?
Unicorn is a lightweight CPU Emulator Framework based on QEMU Emulator.
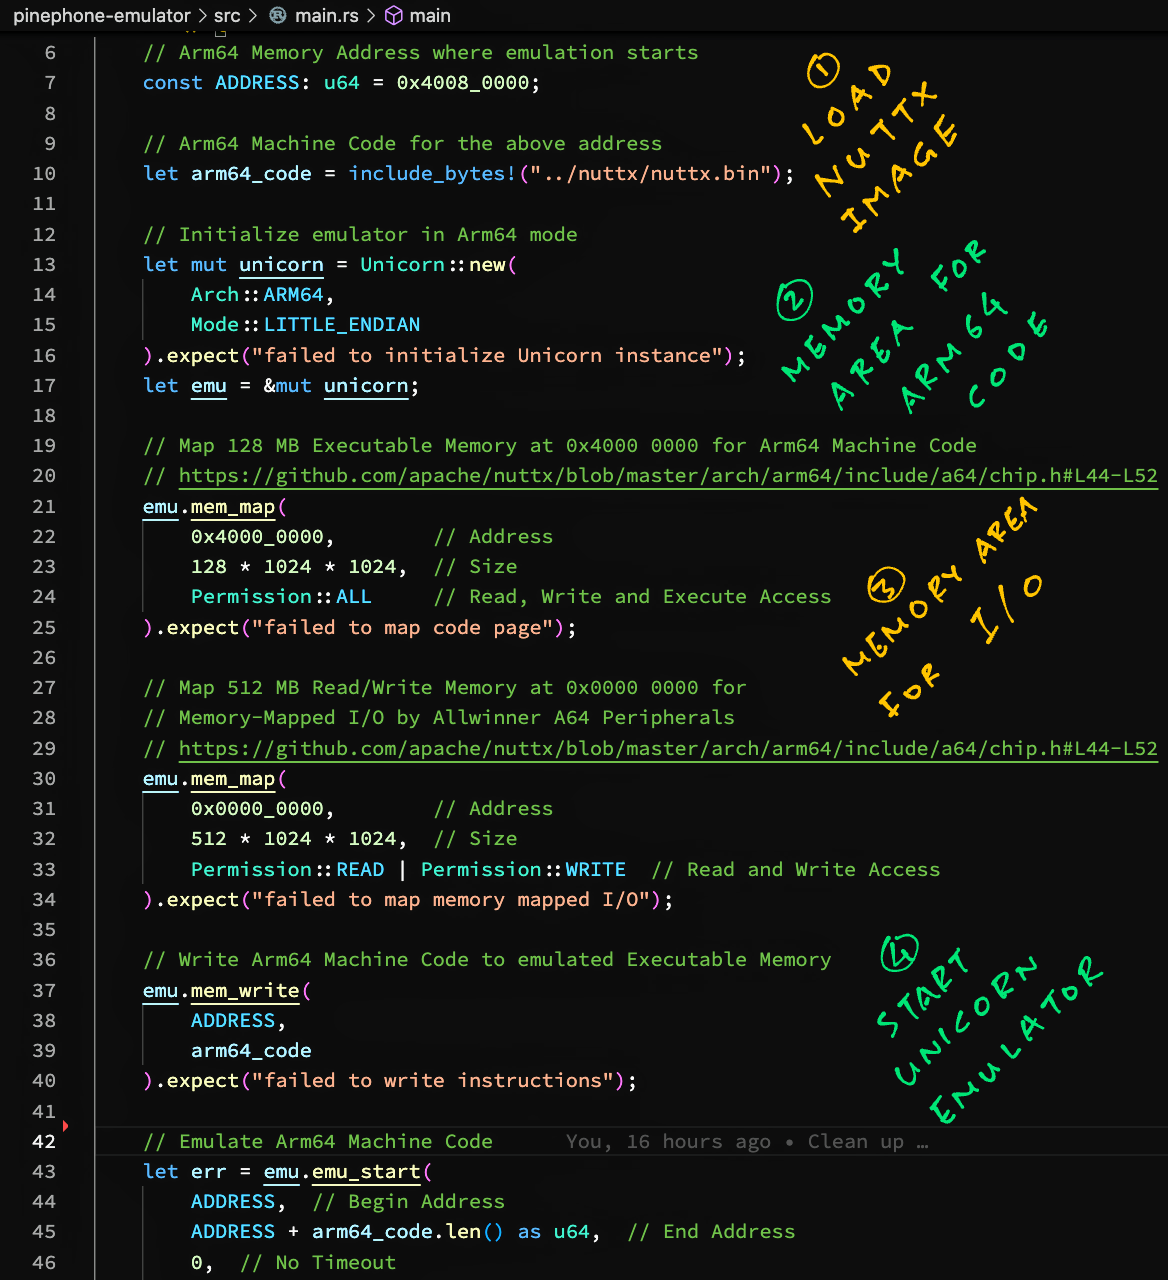
In the last article we called Unicorn (in Rust) to run the Arm64 Machine Code for Apache NuttX RTOS…
// Arm64 Machine Code for Apache NuttX RTOS
let arm64_code = include_bytes!("../nuttx/nuttx.bin");

// Init Unicorn Emulator in Arm64 mode
let mut unicorn = Unicorn::new(
  Arch::ARM64,
  Mode::LITTLE_ENDIAN
).expect("failed to init Unicorn");

// Magical horse mutates to bird
let emu = &mut unicorn;

// Omitted: Map Executable Memory and I/O Memory in Unicorn
...

// Boot NuttX RTOS in Unicorn Emulator
let err = emu.emu_start(
  0x4008_0000,  // Begin Address
  0x4008_0000 + arm64_code.len() as u64,  // End Address
  0,  // No Timeout
  0   // Unlimited number of instructions
);When we run this, NuttX starts booting in the Unicorn Emulator!
→ cargo run

- Ready to Boot CPU
- Boot from EL2
- Boot from EL1
- Boot to C runtime for OS Initialize
So Unicorn works like QEMU Emulator?
Yes but with a fun new twist: Unicorn lets us intercept the Execution of Emulated Code by attaching a Hook Function…
// Add Unicorn Hook that will intercept
// every Block of Arm64 Instructions
let _ = emu.add_block_hook(hook_block)
  .expect("failed to add block hook");
So we can trace the flow of the Emulated Code.
Here’s the Hook Function that will be called whenever Unicorn emulates a Block of Arm64 Instructions…
// Hook Function for Block Emulation.
// Called by Unicorn for every Block of Arm64 Instructions.
fn hook_block(
  _: &mut Unicorn<()>,  // Emulator
  address: u64,  // Address of Arm64 Code Block
  size: u32      // Size of Arm64 Code Block
) {
  // TODO: Trace the flow of emulated code
  println!("hook_block:  address={address:#010x}, size={size:02}");
}Unicorn Emulator calls our Hook Function, passing the…
Address of the Arm64 Code Block being emulated
Size of the Arm64 Code Block being emulated
Let’s modify the Hook Function to tell us what code it’s emulating…
How do we use a Hook Function…
To tell us what code Unicorn is emulating?
Earlier we saw that Unicorn calls our Hook Function with the Address of the Arm64 Code that’s being emulated.
Let’s lookup the Arm64 Code Address to find the Name of the Function that’s running right now…
→ cargo run

hook_block:
  address=0x40080920
  arm64_chip_boot

hook_block:
  address=0x40080e50
arm64_mmu_initHow will we map the Arm64 Address to the Function Name?
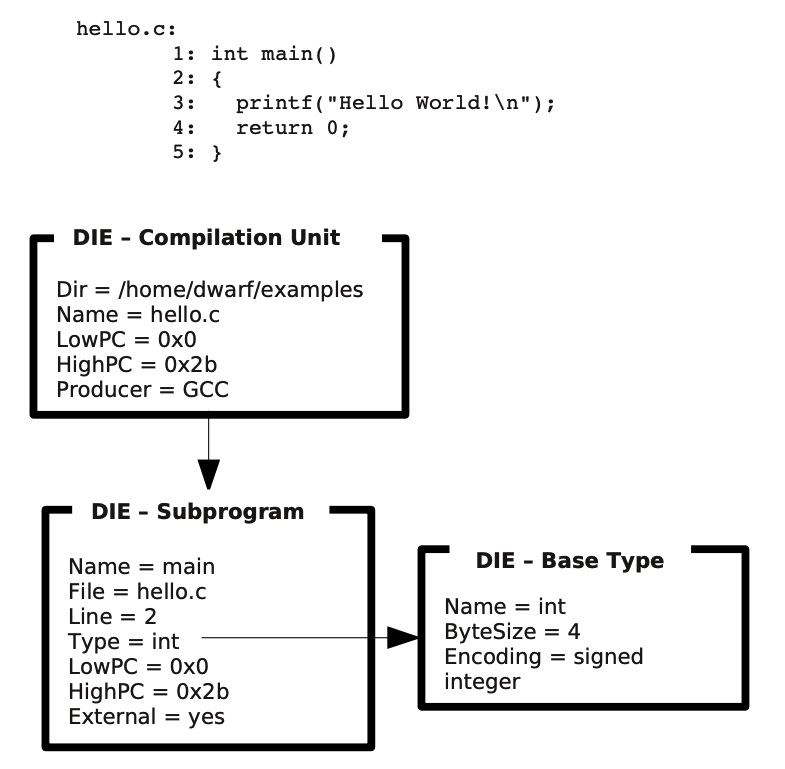
Pretend we’re a Debugger (like GDB). The best way to map an Arm64 Address to the Function Name would be…
The DWARF Debug Symbols in the ELF File!
Assuming we can parse the Debug Symbols (from our ELF File), our Hook Function will translate the Arm64 Address to Function Name like so: main.rs
// Hook Function for Block Emulation.
// Called by Unicorn for every Block of Arm64 Instructions.
fn hook_block(
  _: &mut Unicorn<()>,  // Emulator
  address: u64,  // Address of Arm64 Code Block
  size: u32      // Size of Arm64 Code Block
) {
  print!("hook_block:  address={address:#010x}, size={size:02}");

  // Print the Function Name for the Arm64 Address
  let function = map_address_to_function(address);
  if let Some(ref name) = function {  // If we find the Function Name...
    print!(", {name}");
  }

  // Print the Source Filename, Line Number
  // and Column Number for the Arm64 Address
  let loc = map_address_to_location(address);
  let (ref file, line, col) = loc;
  let file = file.clone().unwrap_or("".to_string());  // Default filename is ""
  let line = line.unwrap_or(0);  // Default line is 0
  let col  = col.unwrap_or(0);   // Default column is 0
  println!(", {file}:{line}:{col}");
}
The Debug Symbols will tell us the Source Filename?
Yep the Source Filename, Line Number and Column Number are in the DWARF Debug Symbols too!
Later we’ll print them to make the Call Graph clickable.
But first we look inside map_address_to_function and map_address_to_location…
How will we load the Debug Symbols from our ELF File?
Our ELF File contains the Debug Symbols in DWARF Format.
The Rust Crates addr2line and gimli will parse the DWARF Debug Symbols in our ELF File.
This is how we call the crates to map an Arm64 Address to Function Name: main.rs
/// Map the Arm64 Code Address to the Function Name
/// by looking up the DWARF Debug Symbols
fn map_address_to_function(
  address: u64         // Arm64 Code Address
) -> Option<String> {  // Return the Function Name

  // Lookup the DWARF Frame for the Arm64 Code Address
  let context = ELF_CONTEXT.context.borrow();
  let mut frames = context.find_frames(address)
    .expect("failed to find frames");

  // Return the Function Name
  if let Some(frame) = frames.next().unwrap() {
    if let Some(func) = frame.function {
      if let Ok(name) = func.raw_name() {
        let s = String::from(name);
        return Some(s);
      }
    }
  }

  // Function Name not found.
  // Probably an Arm64 Assembly Routine.
  None
}
ELF_CONTEXT contains the Parsed Debug Symbols. In the code above, we…
Lookup the Parsed Debug Symbols to find the DWARF Frame that matches the Arm64 Code Address
Extract the Function Name from the DWARF Frame
(We’ll come back to ELF_CONTEXT)
This is how we map an Arm64 Address to Source Filename: main.rs
/// Map the Arm64 Code Address to the Source Filename,
/// Line Number and Column Number
fn map_address_to_location(
  address: u64     // Arm64 Code Address
) -> (             // Return the...
  Option<String>,  // Filename
  Option<u32>,     // Line Number
  Option<u32>      // Column Number
) {
  // Lookup the Source Location for the Arm64 Code Address
  let context = ELF_CONTEXT.context.borrow();
  let loc = context.find_location(address)
    .expect("failed to find location");

  // Return the Source Filename, Line and Column
  if let Some(loc) = loc {
    if let Some(file) = loc.file {

      // Shorten the path
      let s = String::from(file)
        .replace("/private/tmp/nuttx/nuttx/", "")
        .replace("arch/arm64/src/chip", "arch/arm64/src/a64");  // TODO: Handle other chips
      (Some(s), loc.line, loc.column)
    } else {
      // If Filename is missing, return the Line and Column
      (None, loc.line, loc.column)
    }
  } else {
    // Filename, Line and Column are missing
    (None, None, None)
  }
}
In the code above, we…
Lookup the Parsed Debug Symbols to find the DWARF Location that matches the Arm64 Code Address
Extract the Source Filename, Line and Column from the DWARF Location
Now that we’ve extracted the Function Name and Source Filename from our ELF File, our Hook Function will print meaningful traces of our Emulated Program…
→ cargo run

hook_block:
  address=0x40080920
  size=12
  arm64_chip_boot
  arch/arm64/src/chip/a64_boot.c:82:1

hook_block:
  address=0x40080e50
  size=28
  arm64_mmu_init
arch/arm64/src/common/arm64_mmu.c:584:1Which are super helpful for figuring out what’s happening inside Unicorn Emulator!
What’s ELF_CONTEXT?
ELF_CONTEXT contains the Parsed Debug Symbols from our ELF File.
Here’s how we call the addr2line and gimli libraries to parse the Debug Symbols…
Clickable Call Graph for Apache NuttX RTOS
As Unicorn Emulator runs, it prints a long list of Function Names…
How can we make sense of the Function Names?
Let’s transform the long list of Function Names…
Into a Clickable Call Graph that shows exactly how the functions are called!
Whoa! We need a special diagramming tool?
Actually we can render a Mermaid Flowchart by simply printing this in Markdown Format…
```mermaid
flowchart TD
START --> arm64_head
arm64_head --> a64_lowputc
arm64_head --> arm64_boot_primary_c_routine
...(TD means Top-Down Flowchart)
To make a Clickable Mermaid Flowchart, we print the URLs like so…
click arm64_head href "https://github.com/apache/nuttx/blob/master/arch/arm64/src/common/arm64_head.S#L104" "arch/arm64/src/common/arm64_head.S" _blankThis jumps to the NuttX Source Code when we click the Function Name.
(Second part of href is the Mouseover Tooltip)
To preview the flowchart and check the hyperlinks, we use this handy web tool…
How will we generate the Clickable Call Graph?
Remember our Hook Function that intercepts every Block of Arm64 Instructions emulated by Unicorn?
Let’s print the Call Graph inside our Hook Function: main.rs
// Hook Function for Block Emulation.
// Called by Unicorn for every Block of Arm64 Instructions.
fn hook_block(
  _: &mut Unicorn<()>,  // Emulator
  address: u64,  // Address of Arm64 Code Block
  size: u32      // Size of Arm64 Code Block
) {
  // Get the Function Name for the Arm64 Address
  let function = map_address_to_function(address);
  ...

  // Get the Source Filename for the Arm64 Address
  let loc = map_address_to_location(address);
  ...

  // Print the Call Graph
  call_graph(address, size, function, loc);
}
Now we look inside the call_graph function…
Our Hook Function calls call_graph to print the Call Graph…
What’s inside call_graph?
Earlier we said that we’re generating this Clickable Call Graph…
Which needs a Mermaid Flowchart like this…
```mermaid
flowchart TD
START --> arm64_head
arm64_head --> a64_lowputc
click arm64_head href "https://github.com/apache/nuttx/blob/master/arch/arm64/src/common/arm64_head.S#L104" "arch/arm64/src/common/arm64_head.S" _blank
...Our Hook Function calls call_graph, which prints the Mermaid Flowchart (line by line) like so: main.rs
/// Print the Mermaid Call Graph for this Function Call:
/// cargo run | grep call_graph | cut -c 12-
fn call_graph(
  _address: u64,  // Address of Arm64 Code Block
  _size: u32,     // Size of Arm64 Code Block
  function: Option<String>,  // Function Name
  loc: (             // Source Location
    Option<String>,  // Filename
    Option<u32>,     // Line
    Option<u32>      // Column
  )
) {
  // Get the Function Name
  let fname = match function {
    Some(fname) => fname,
    None => map_location_to_function(&loc)
  };

  // Skip if we are still in the same Function
  let mut last_fname = LAST_FNAME.lock().unwrap();
  let mut last_loc = LAST_LOC.lock().unwrap();
  if fname.eq(last_fname.as_str()) { return; }
call_graph receives the Function Name and Source Filename, which we have loaded from the ELF File.
(map_location_to_function is defined here)
What are last_fname and last_loc?
We remember the Previous Function Name (last_fname) and Previous Filename (last_loc)…
So we can connect the Calling Function with the Called Function in our Call Graph.
(OK this doesn’t always work… But it’s good enough!)
This is how we start the Call Graph…
  // GitHub won't render Mermaid Markdown that's too long.
  // If this function has not been shown too often...
  if can_show_function(&fname) {
    // Print the Call Flow
    if last_fname.is_empty() {
      println!("call_graph:  flowchart TD");  // Top-Down Flowchart
println!("call_graph: START --> {fname}");(can_show_function is defined here)
And this is how we connect the Calling Function with the Called Function…
    } else {
      // URL looks like https://github.com/apache/nuttx/blob/master/arch/arm64/src/common/arm64_mmu.c#L541
      let (file, line, _) = last_loc.clone();
      let file = file.unwrap_or("".to_string());
      let line = line.unwrap_or(1) - 1;
      let url = format!("https://github.com/apache/nuttx/blob/master/{file}#L{line}");
      println!("call_graph:  {last_fname} --> {fname}");
      println!("call_graph:  click {last_fname} href \"{url}\" \"{file} \"");
    }
  }

  // Remember the Function Name and Source Location
  *last_fname = fname;
  *last_loc = loc;
}
To generate the Call Graph (via Unicorn Emulator), we run this command…
cargo run \
  | grep call_graph \
| cut -c 12-(cut removes columns 1 to 11)
Unicorn Emulator runs our Arm64 Machine Code, intercepts every Arm64 Instruction and generates the Call Graph.
Thus finally we get our super-informative Clickable Call Graph… That tells us how every function gets called!
Now we analyse the Call Graph for NuttX RTOS…
Clickable Call Graph for Apache NuttX RTOS
NuttX halts with a Memory Management Fault when it boots…
What can the Call Graph tell us about the fault?
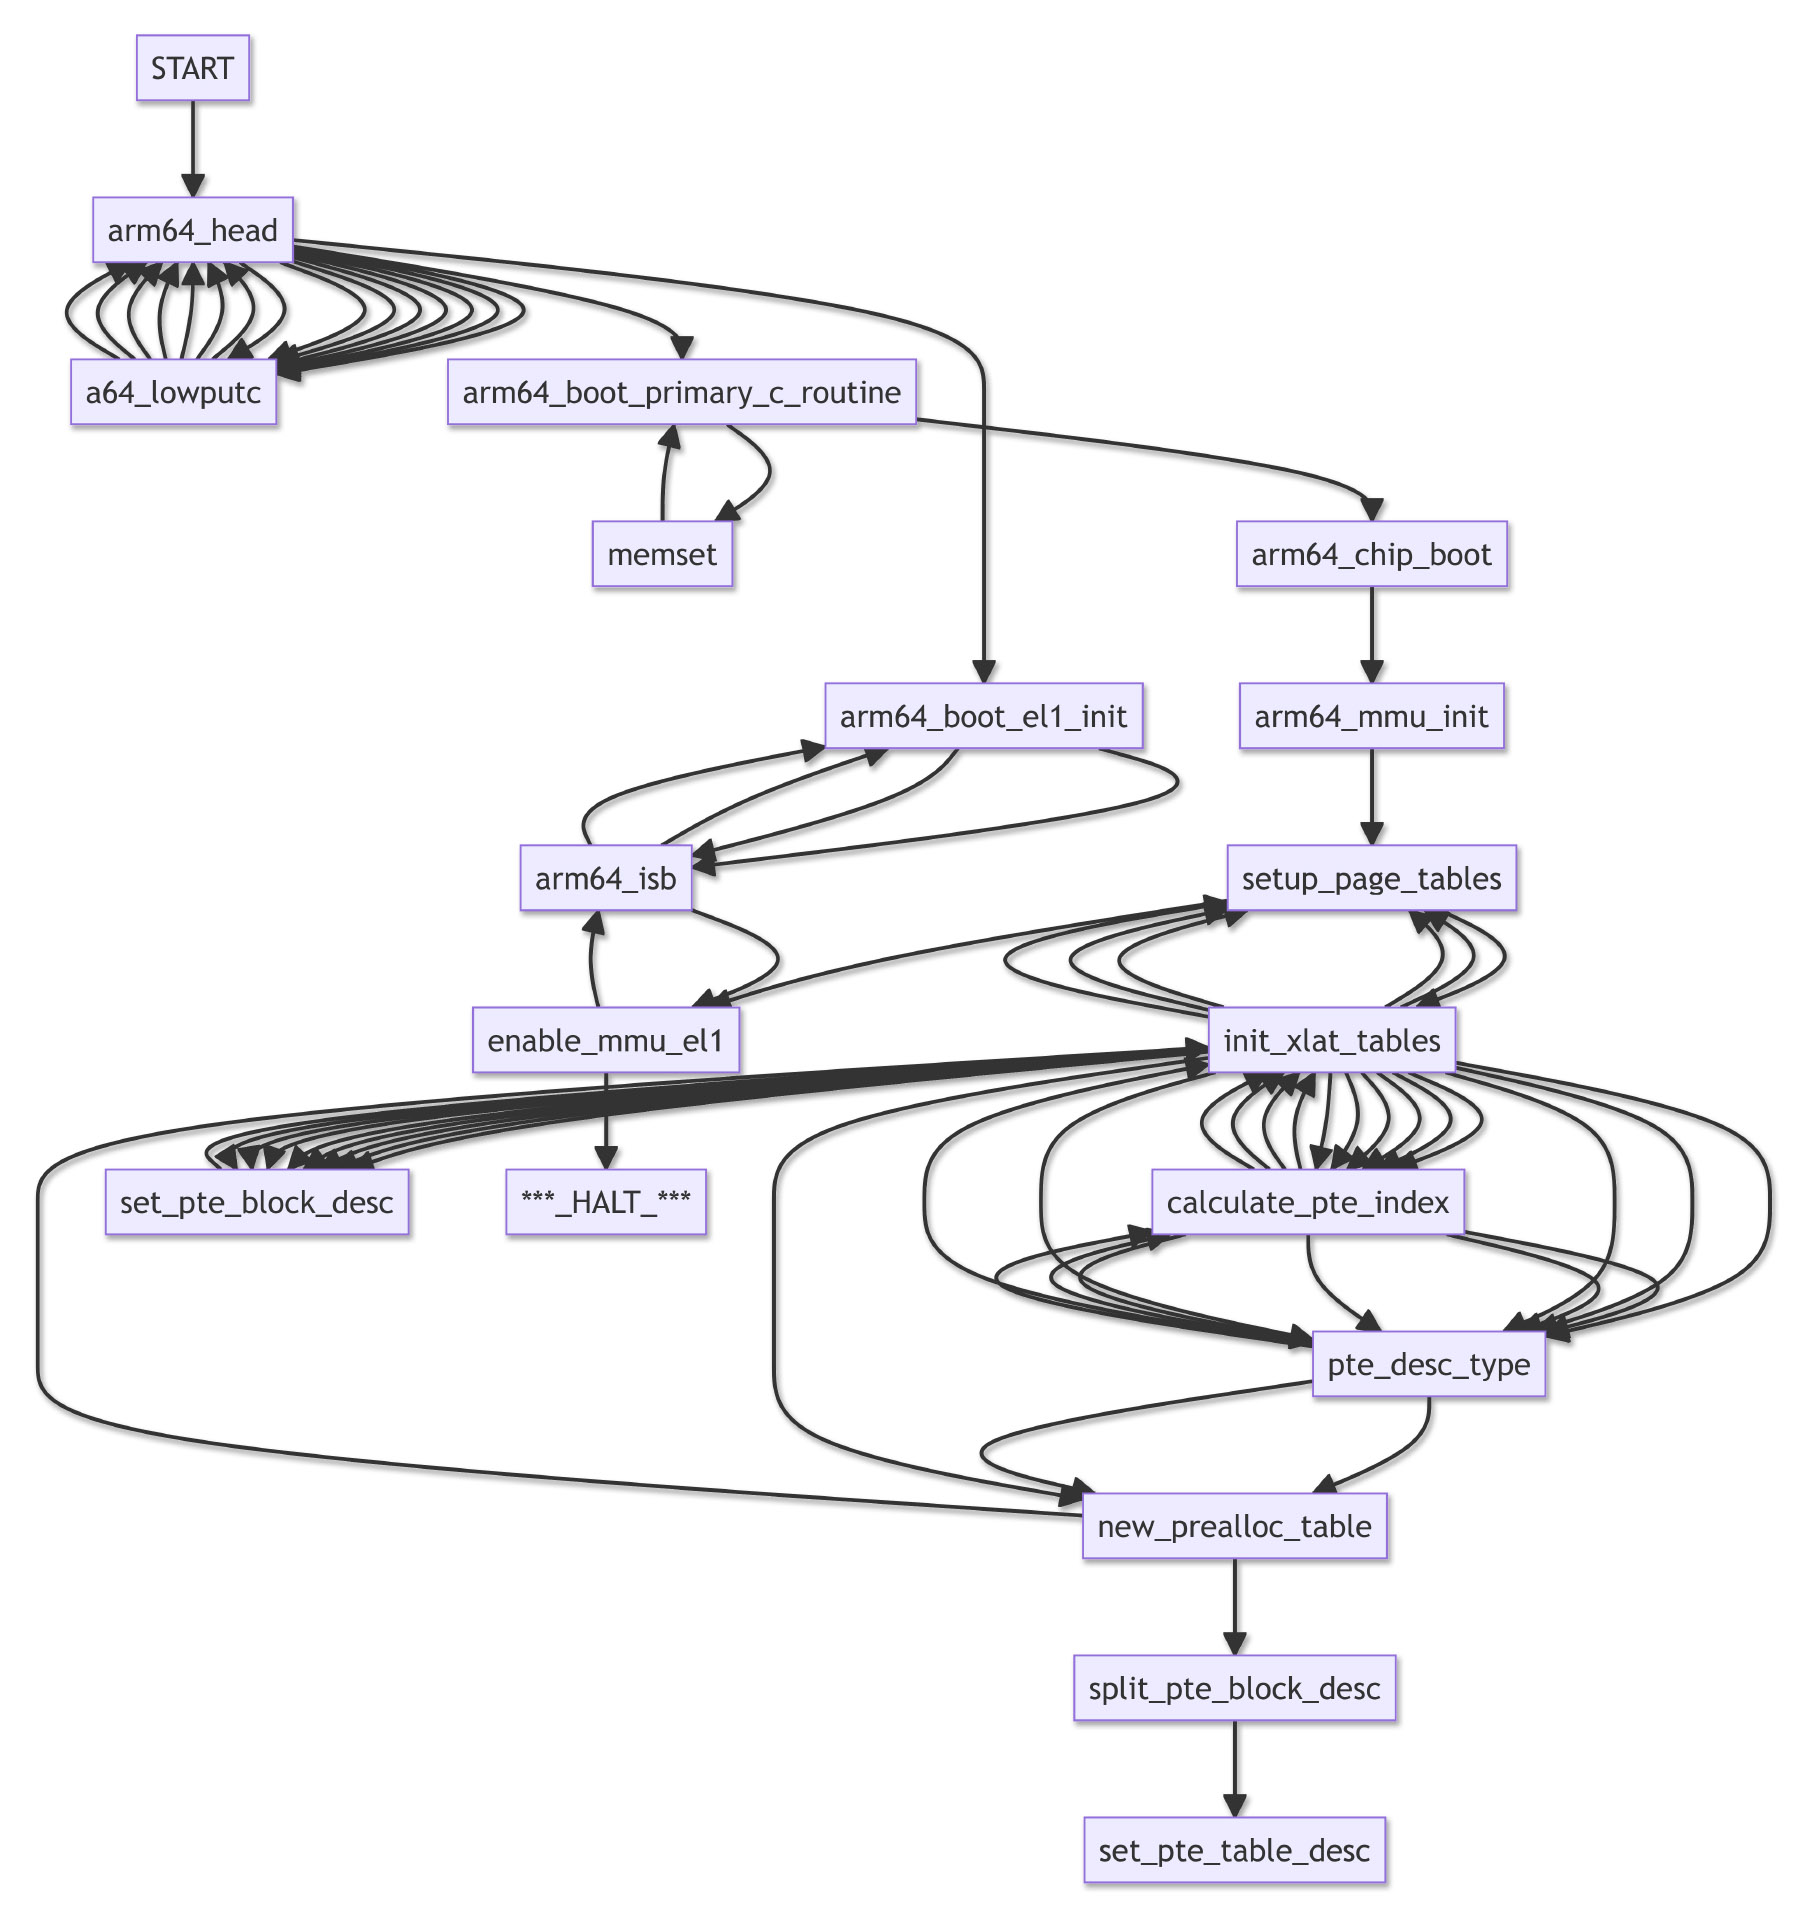
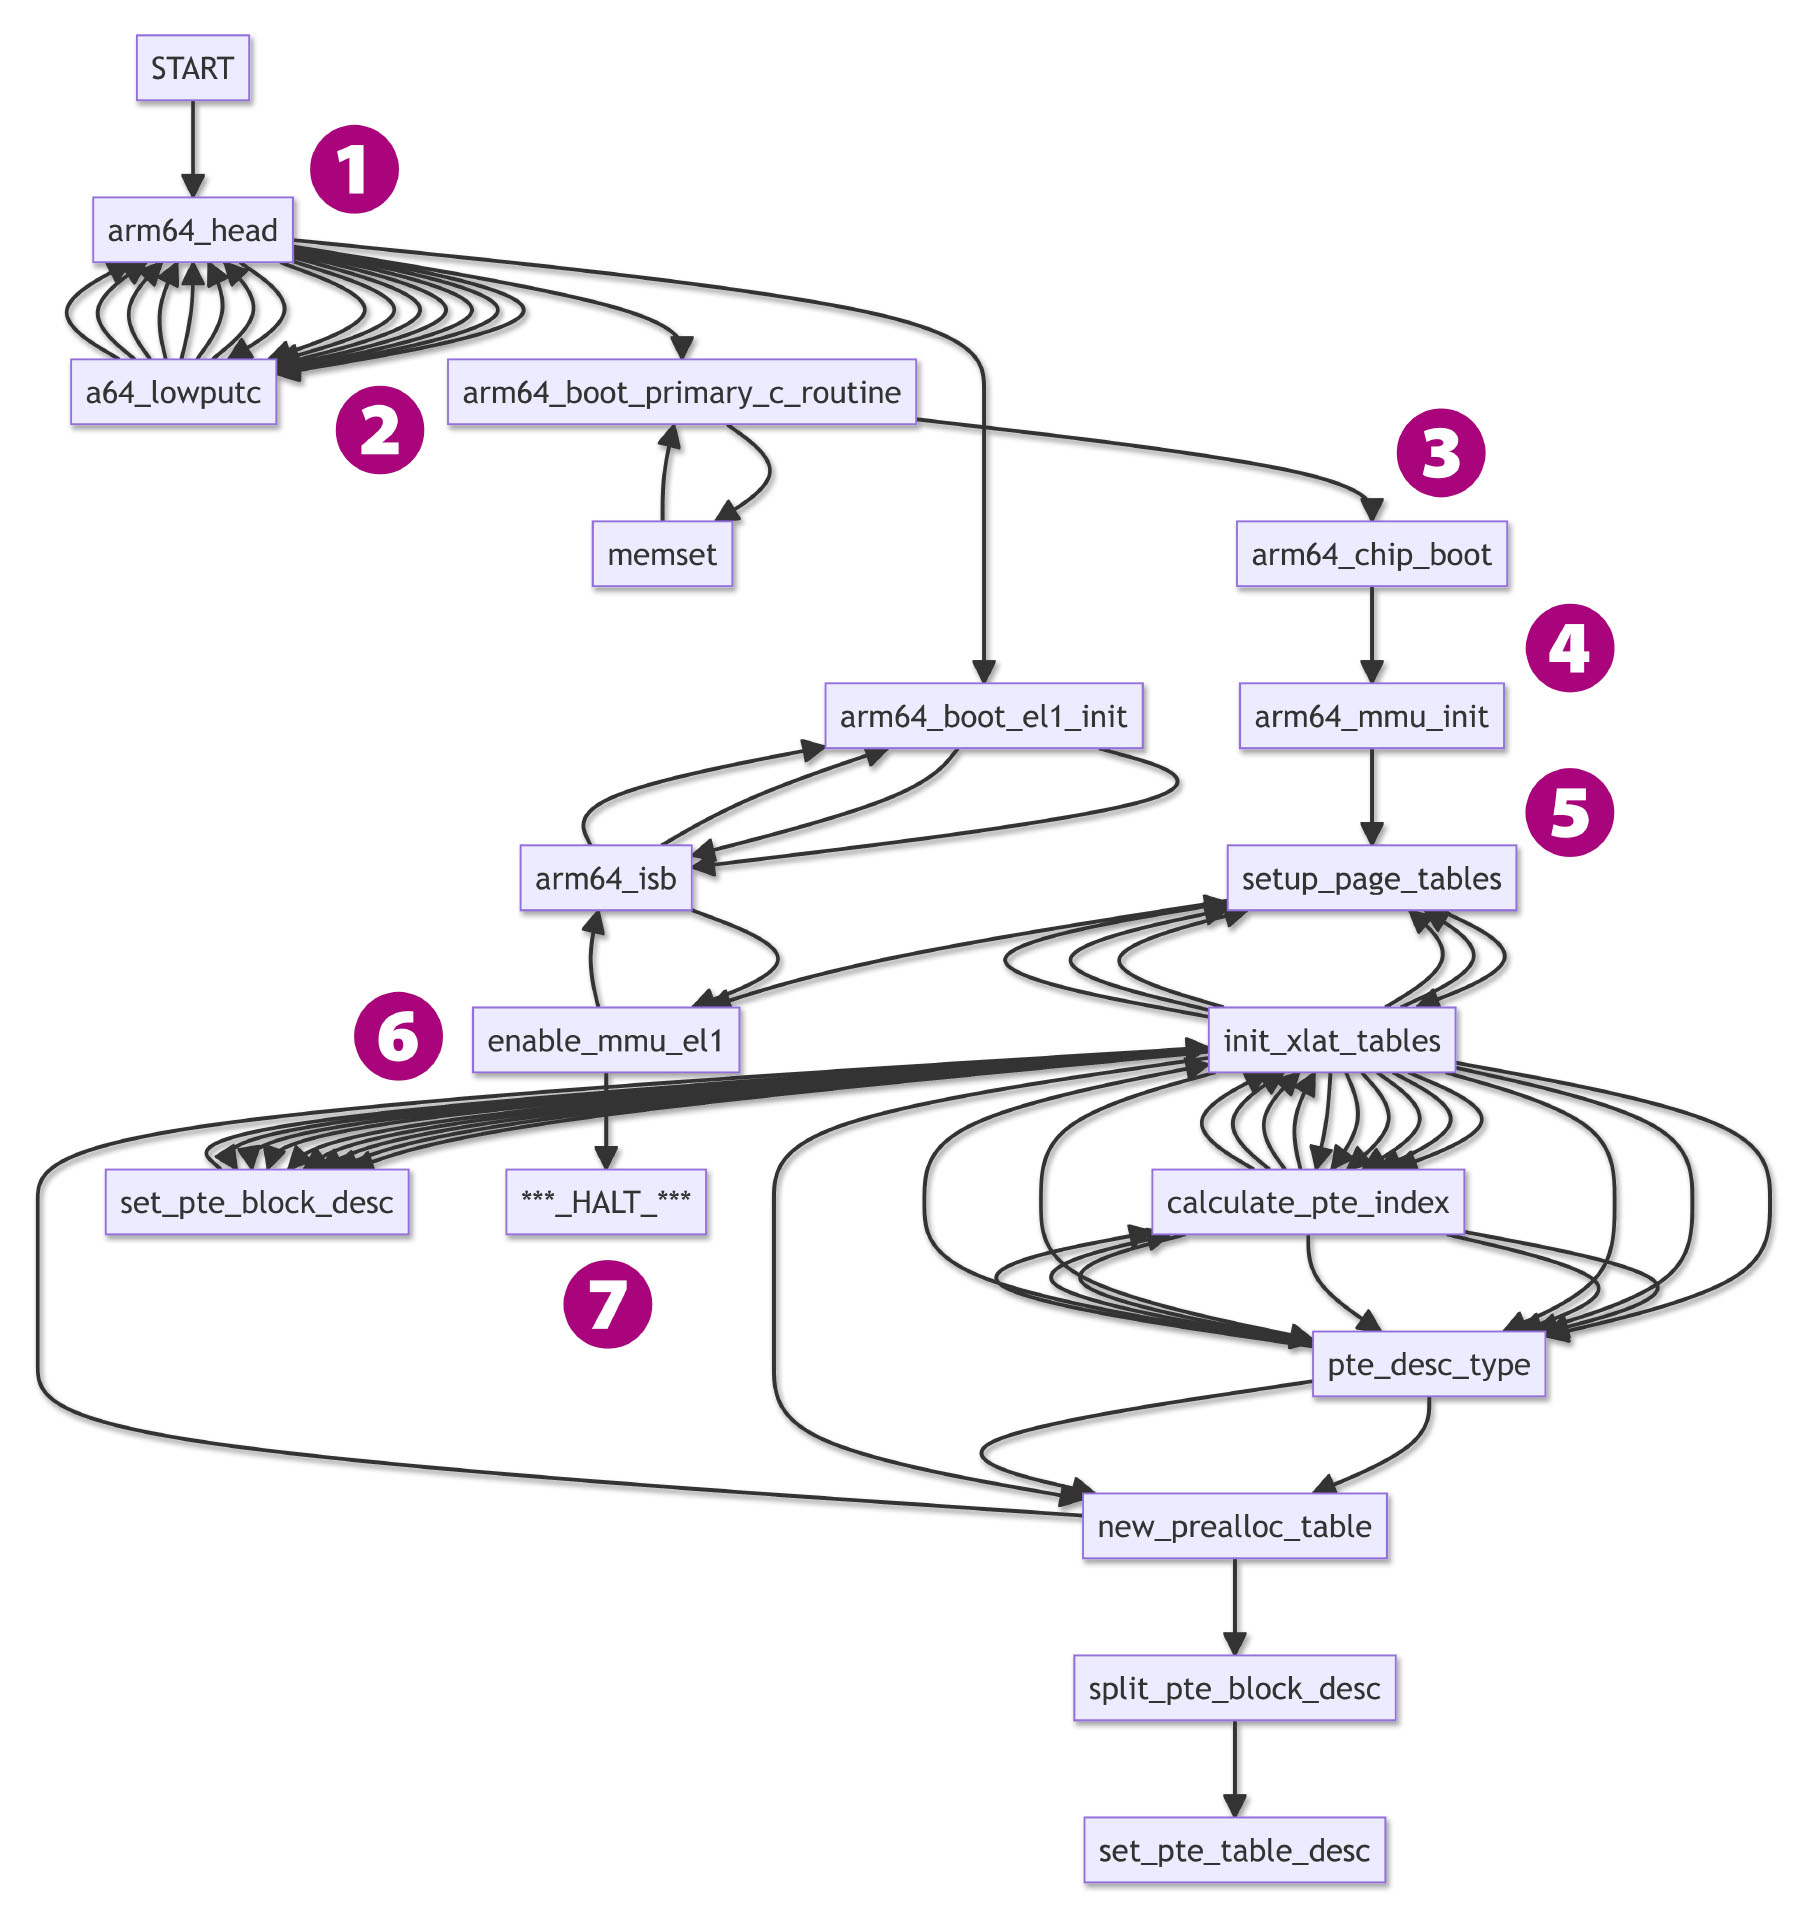
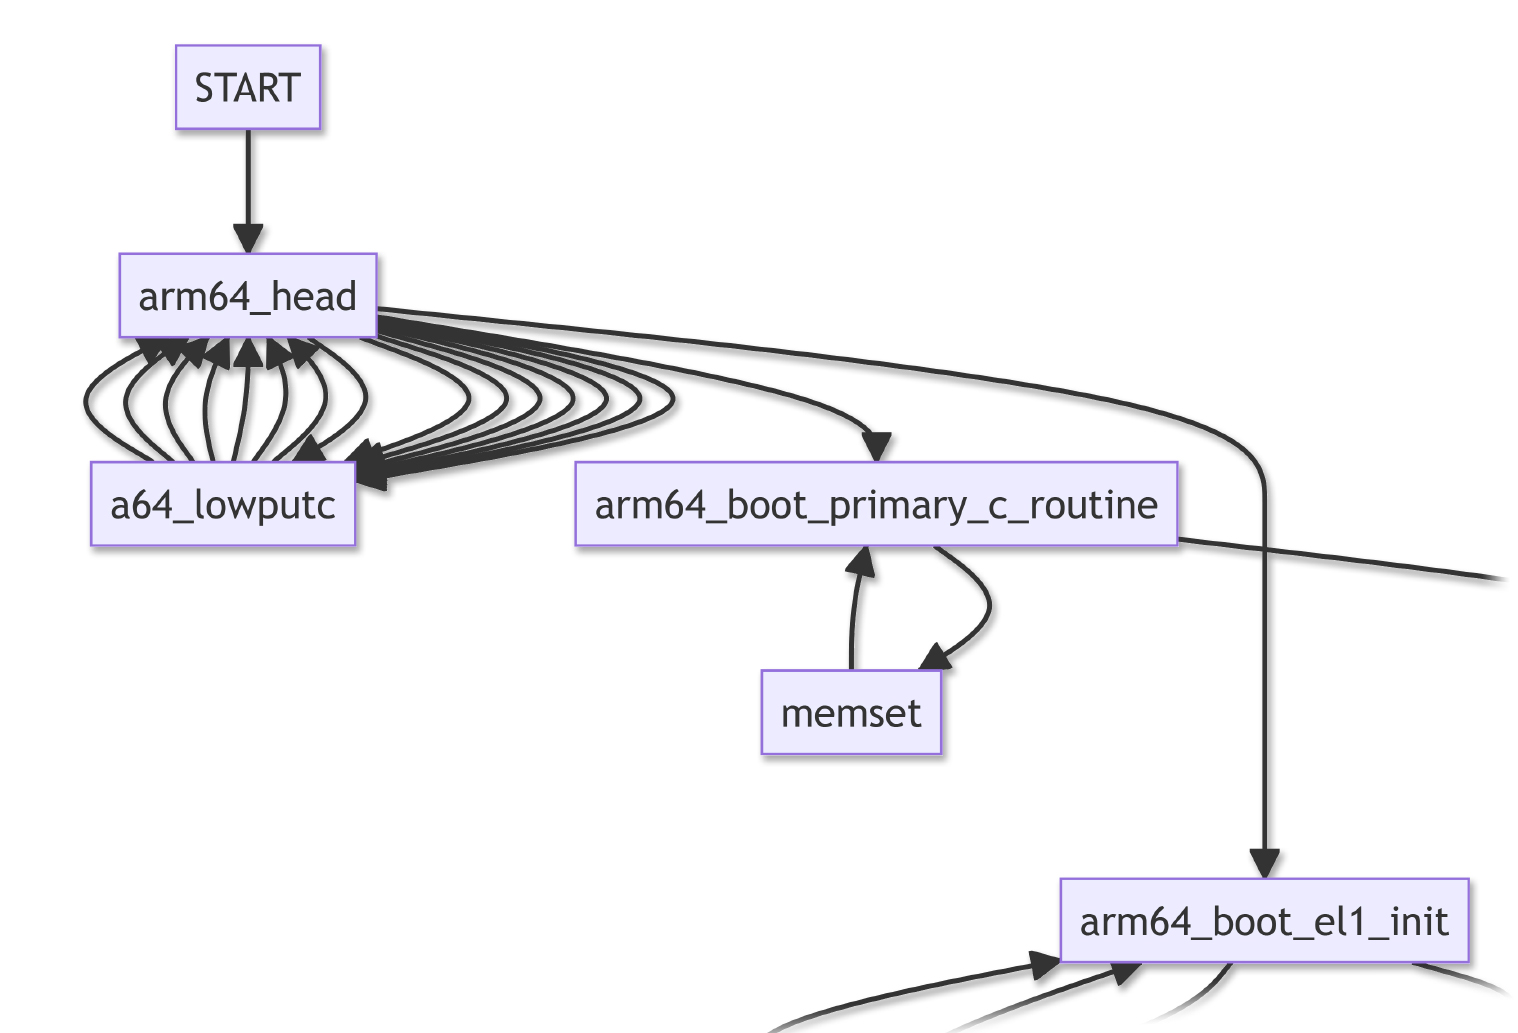
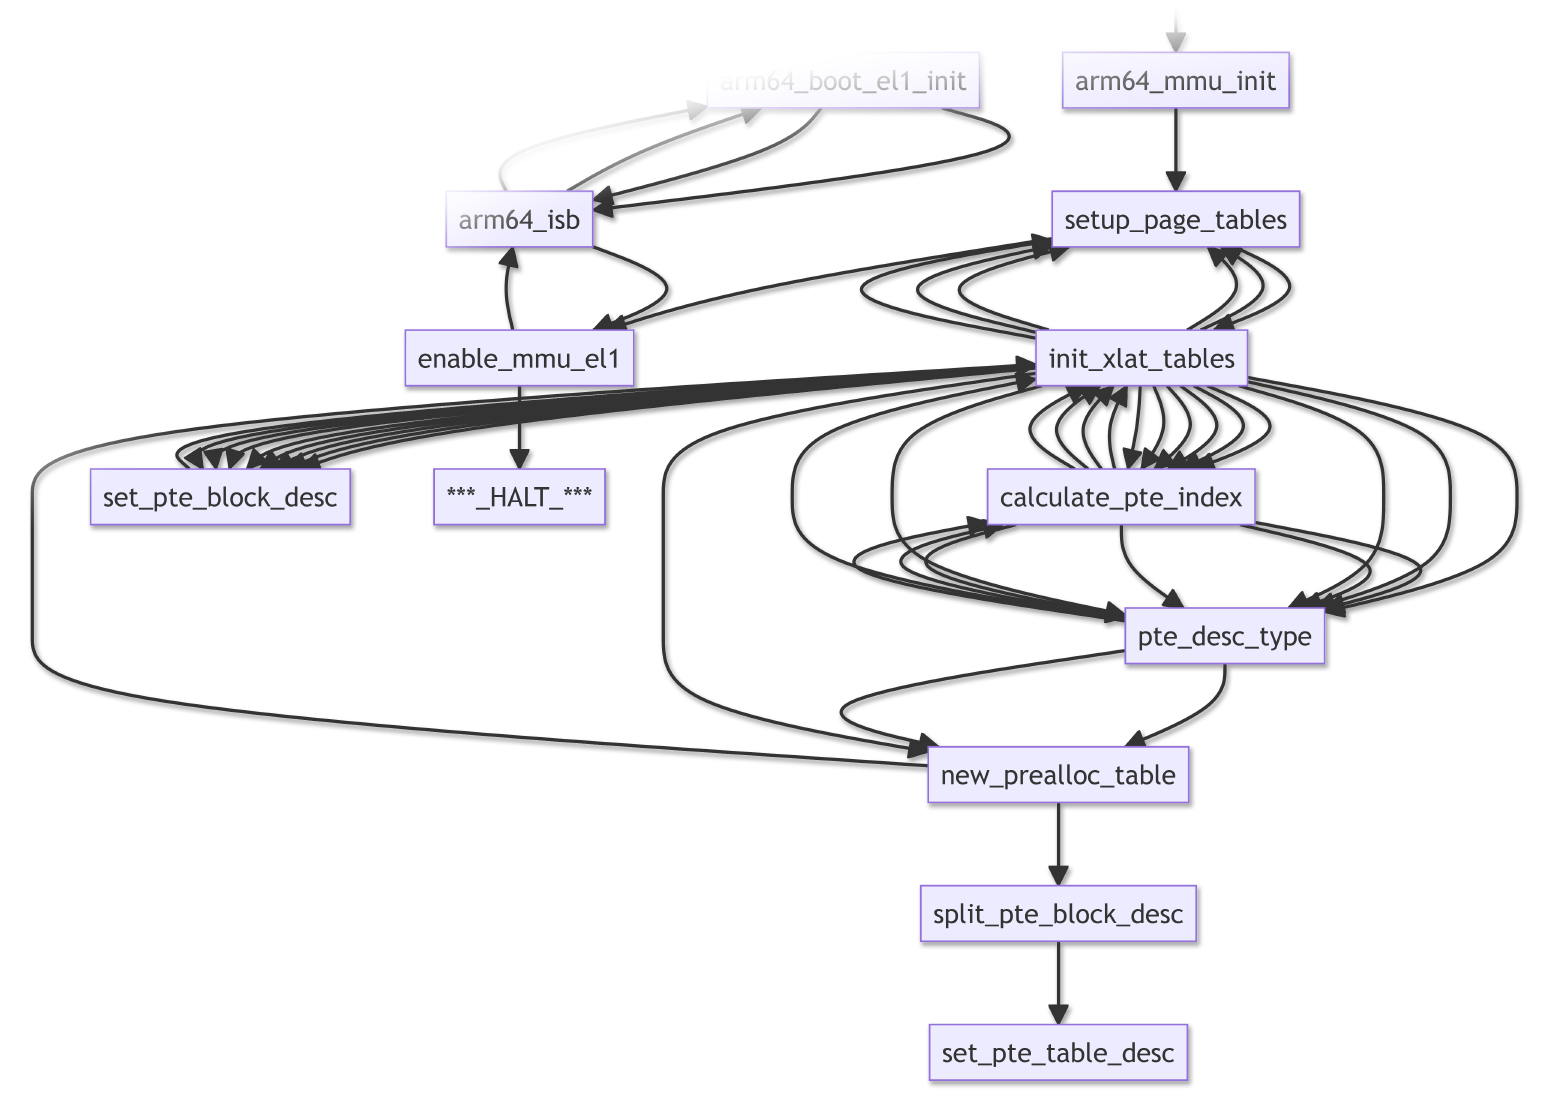
We click and walk through the Call Graph to find out what went wrong, from START to HALT (pic above)…
NuttX starts at arm64_head
(To prepare Arm64 Exception Levels 1 and 2)
Which calls arm64_boot_primary_c_routine
(To start the NuttX Kernel)
Which calls arm64_chip_boot
(To configure the Arm64 CPU)
Which calls arm64_mmu_init
(To initialise the Arm64 Memory Management Unit)
Which calls setup_page_tables
(To set up the Arm64 Memory Page Tables)
And calls enable_mmu_el1
(To enable the Arm64 Memory Management Unit)
Which halts with an Arm64 Memory Management Fault
To understand what’s really happening, we dive into each of the above functions.
How is this relevant to PinePhone?
Unicorn Emulator runs the exact same Arm64 Machine Code as NuttX for PinePhone…
Whatever happens in Unicorn Emulator… Will happen in PinePhone too!
Hence along the way we’ll learn how exactly NuttX boots on PinePhone.
arm64_head is the first thing that runs when NuttX boots on Unicorn Emulator. (And PinePhone)
(It looks like a Linux Kernel Header, hence the name)
The assembly code calls…
arm64_boot_el1_init to prepare Arm64 Exception Level 1
arm64_boot_primary_c_routine to boot the NuttX Kernel
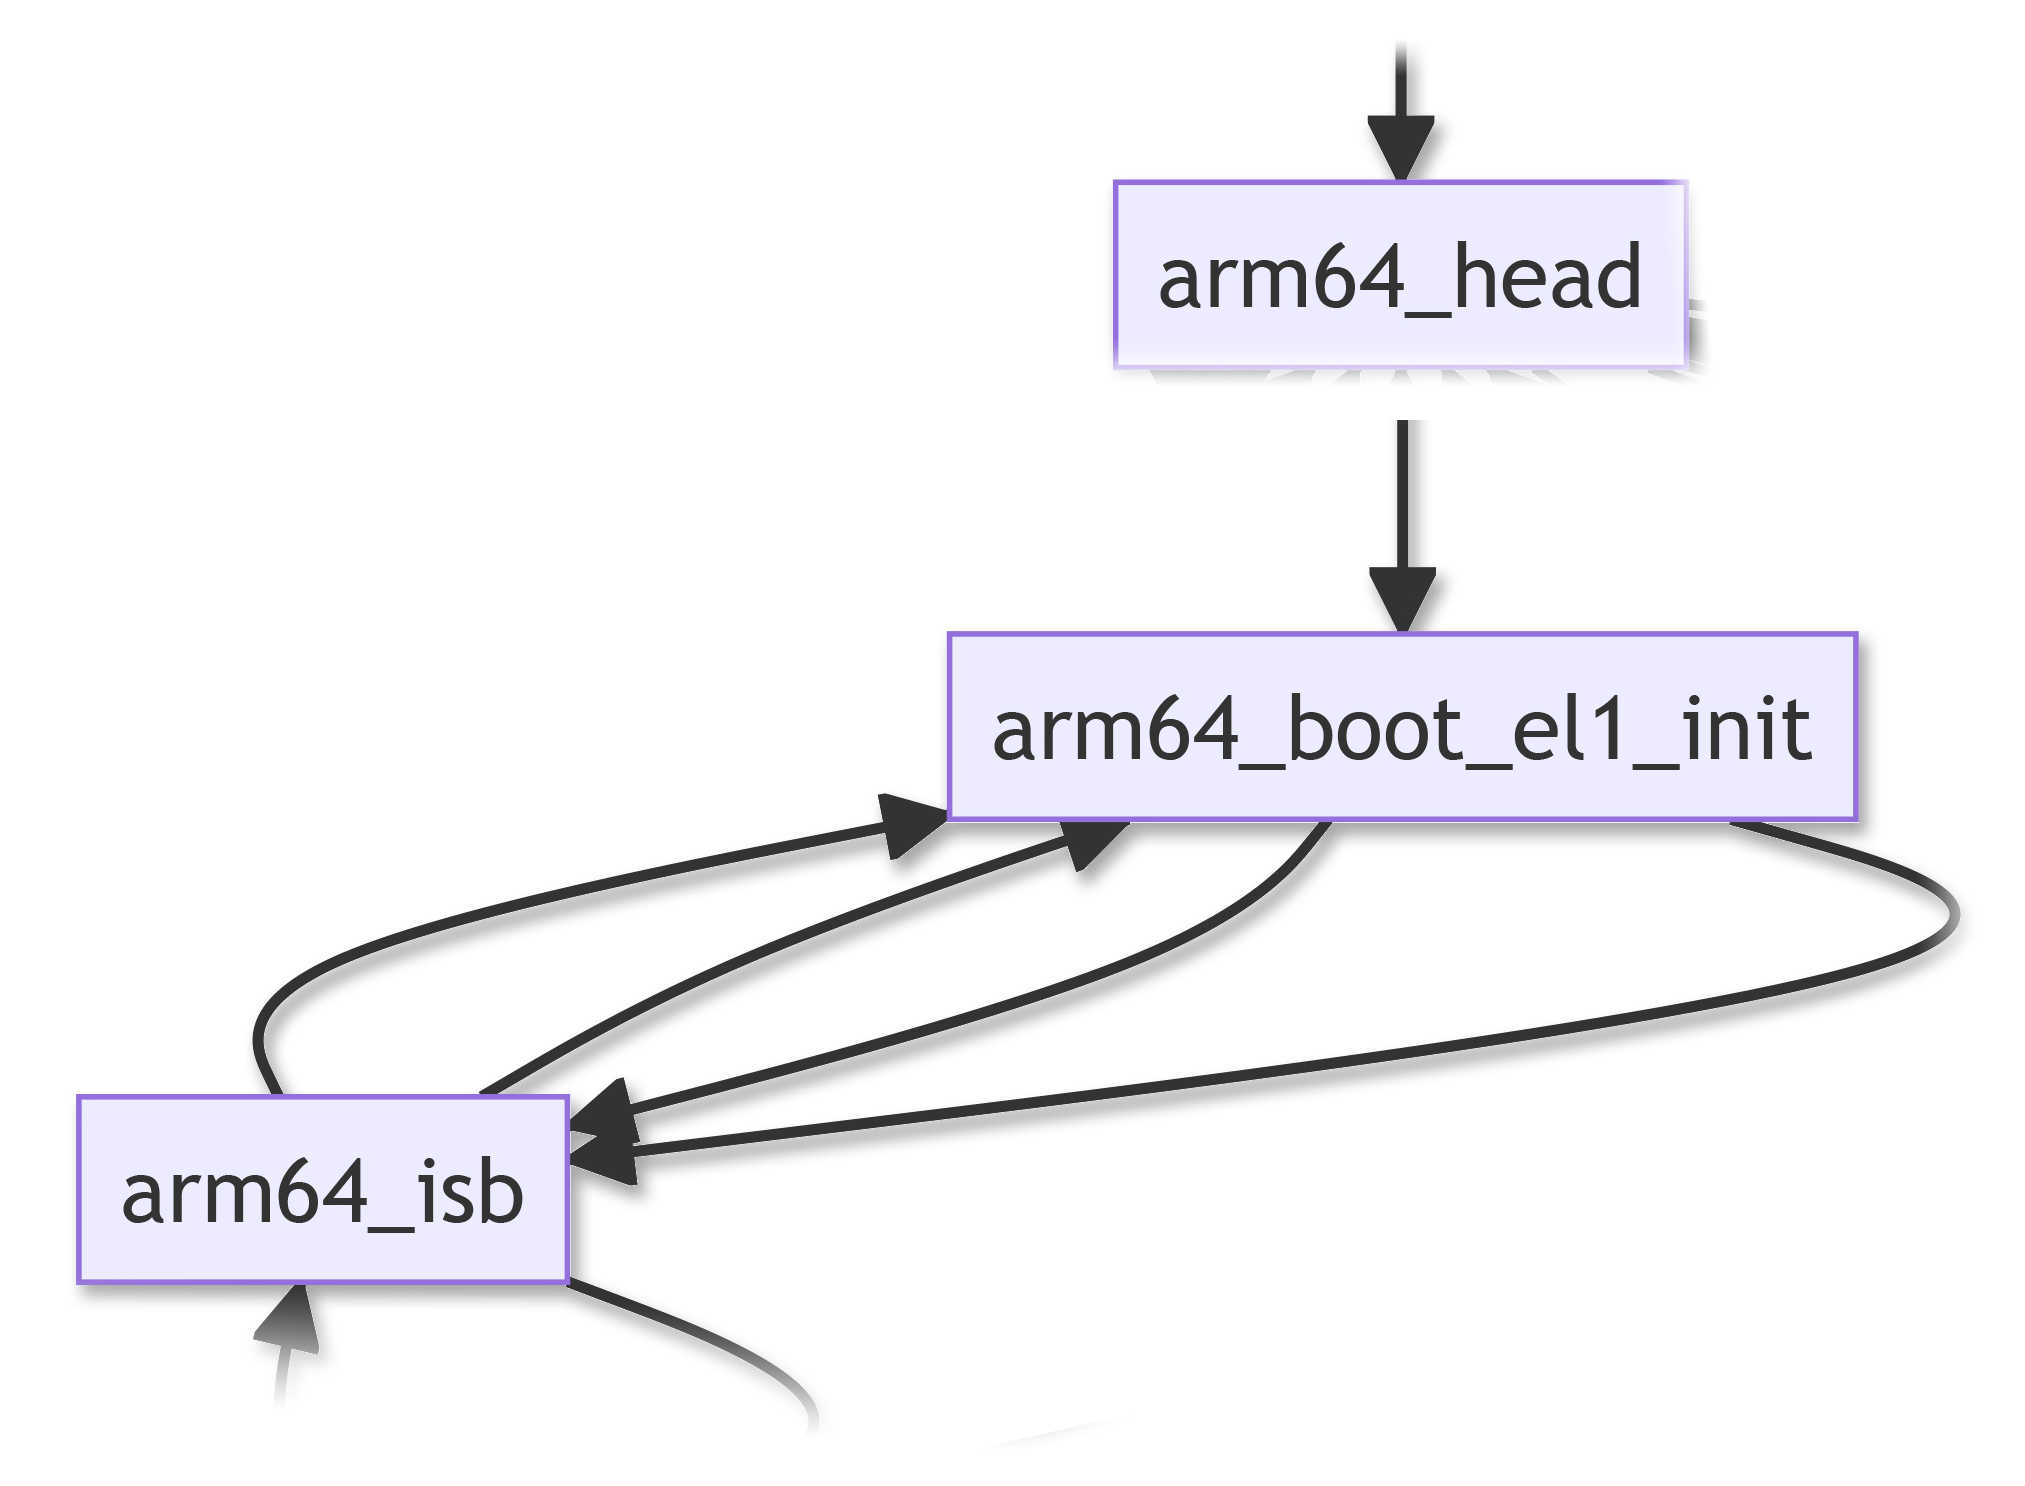
arm64_boot_el1_init prepares Arm64 Exception Level 1 (EL1) for booting NuttX…
VBAR EL1: Set the EL1 Vector Table in the Arm64 Vector Base Address Register
CPACR EL1: Set the Arm64 Architectural Feature Access Control Register
SCTLR EL1: Set the Arm64 System Control Register
CNTV CVAL EL0: Set the Arm64 Counter-Timer Virtual Timer Compare-Value Register
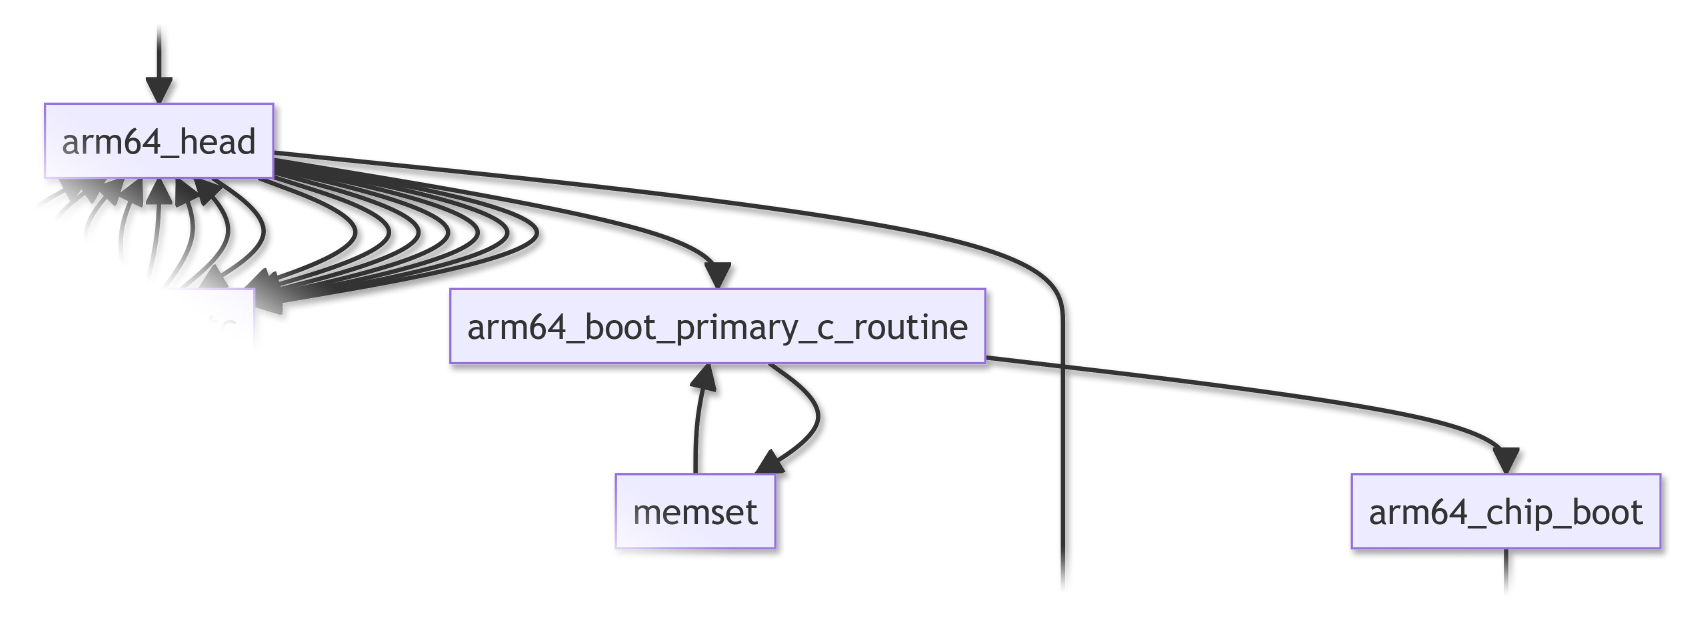
arm64_boot_primary_c_routine starts the NuttX Kernel. It calls…
boot_early_memset to fill the BSS Section with 0
arm64_chip_boot to configure the Arm64 CPU
And more… We’ll come back to the Primary Routine in the next chapter.
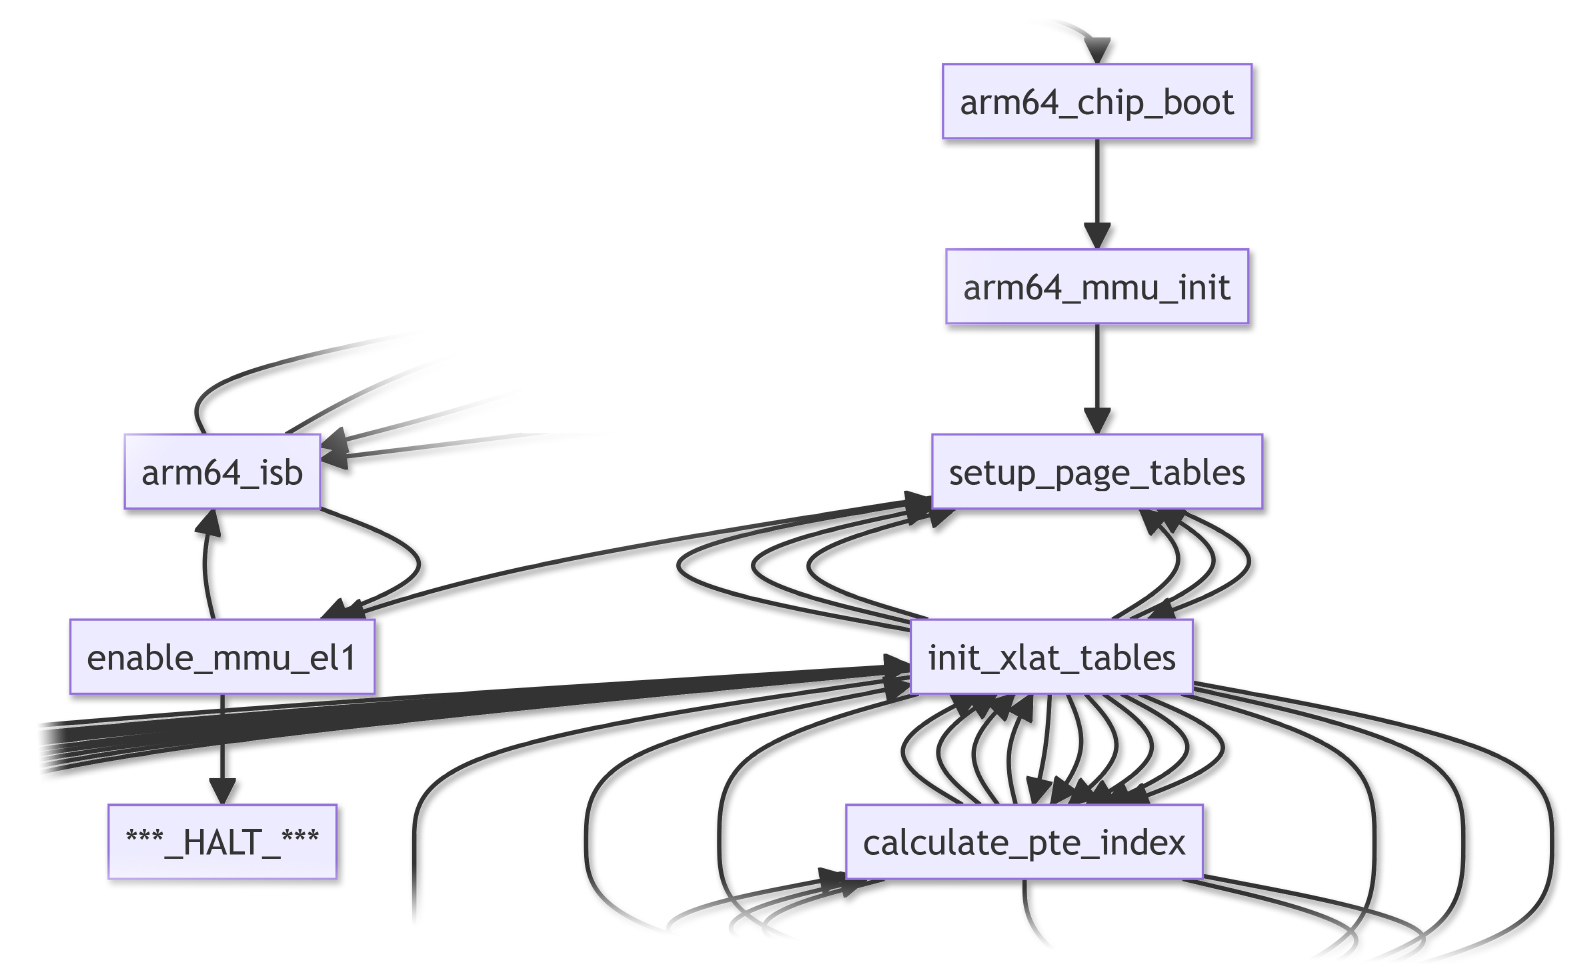
arm64_chip_boot configures the Arm64 CPU. It calls…
arm64_mmu_init: To initialise the Arm64 Memory Management Unit for Exception Level 1
Which calls setup_page_tables: To set up the Arm64 Memory Translation Tables
And calls enable_mmu_el1: To enable the Arm64 Memory Management Unit and Data Cache for Exception Level 1
Which halts with an Arm64 Memory Management Fault: Invalid Arm64 Address Translation or Caching at 0x400C 3FFF
What caused the Arm64 Memory Management Fault?
The fault happens only in Unicorn Emulator, not on PinePhone. So it might be caused by our configuration of Unicorn Emulator.
We’ll come back to this in a while. First we talk about the rest of the NuttX Boot Sequence…
Suppose we fix the Arm64 Memory Management Fault…
What will happen next?
Right now we have an Arm64 Memory Management Fault that gets tripped inside arm64_chip_boot.
(Only in Unicorn Emulator, not on PinePhone)
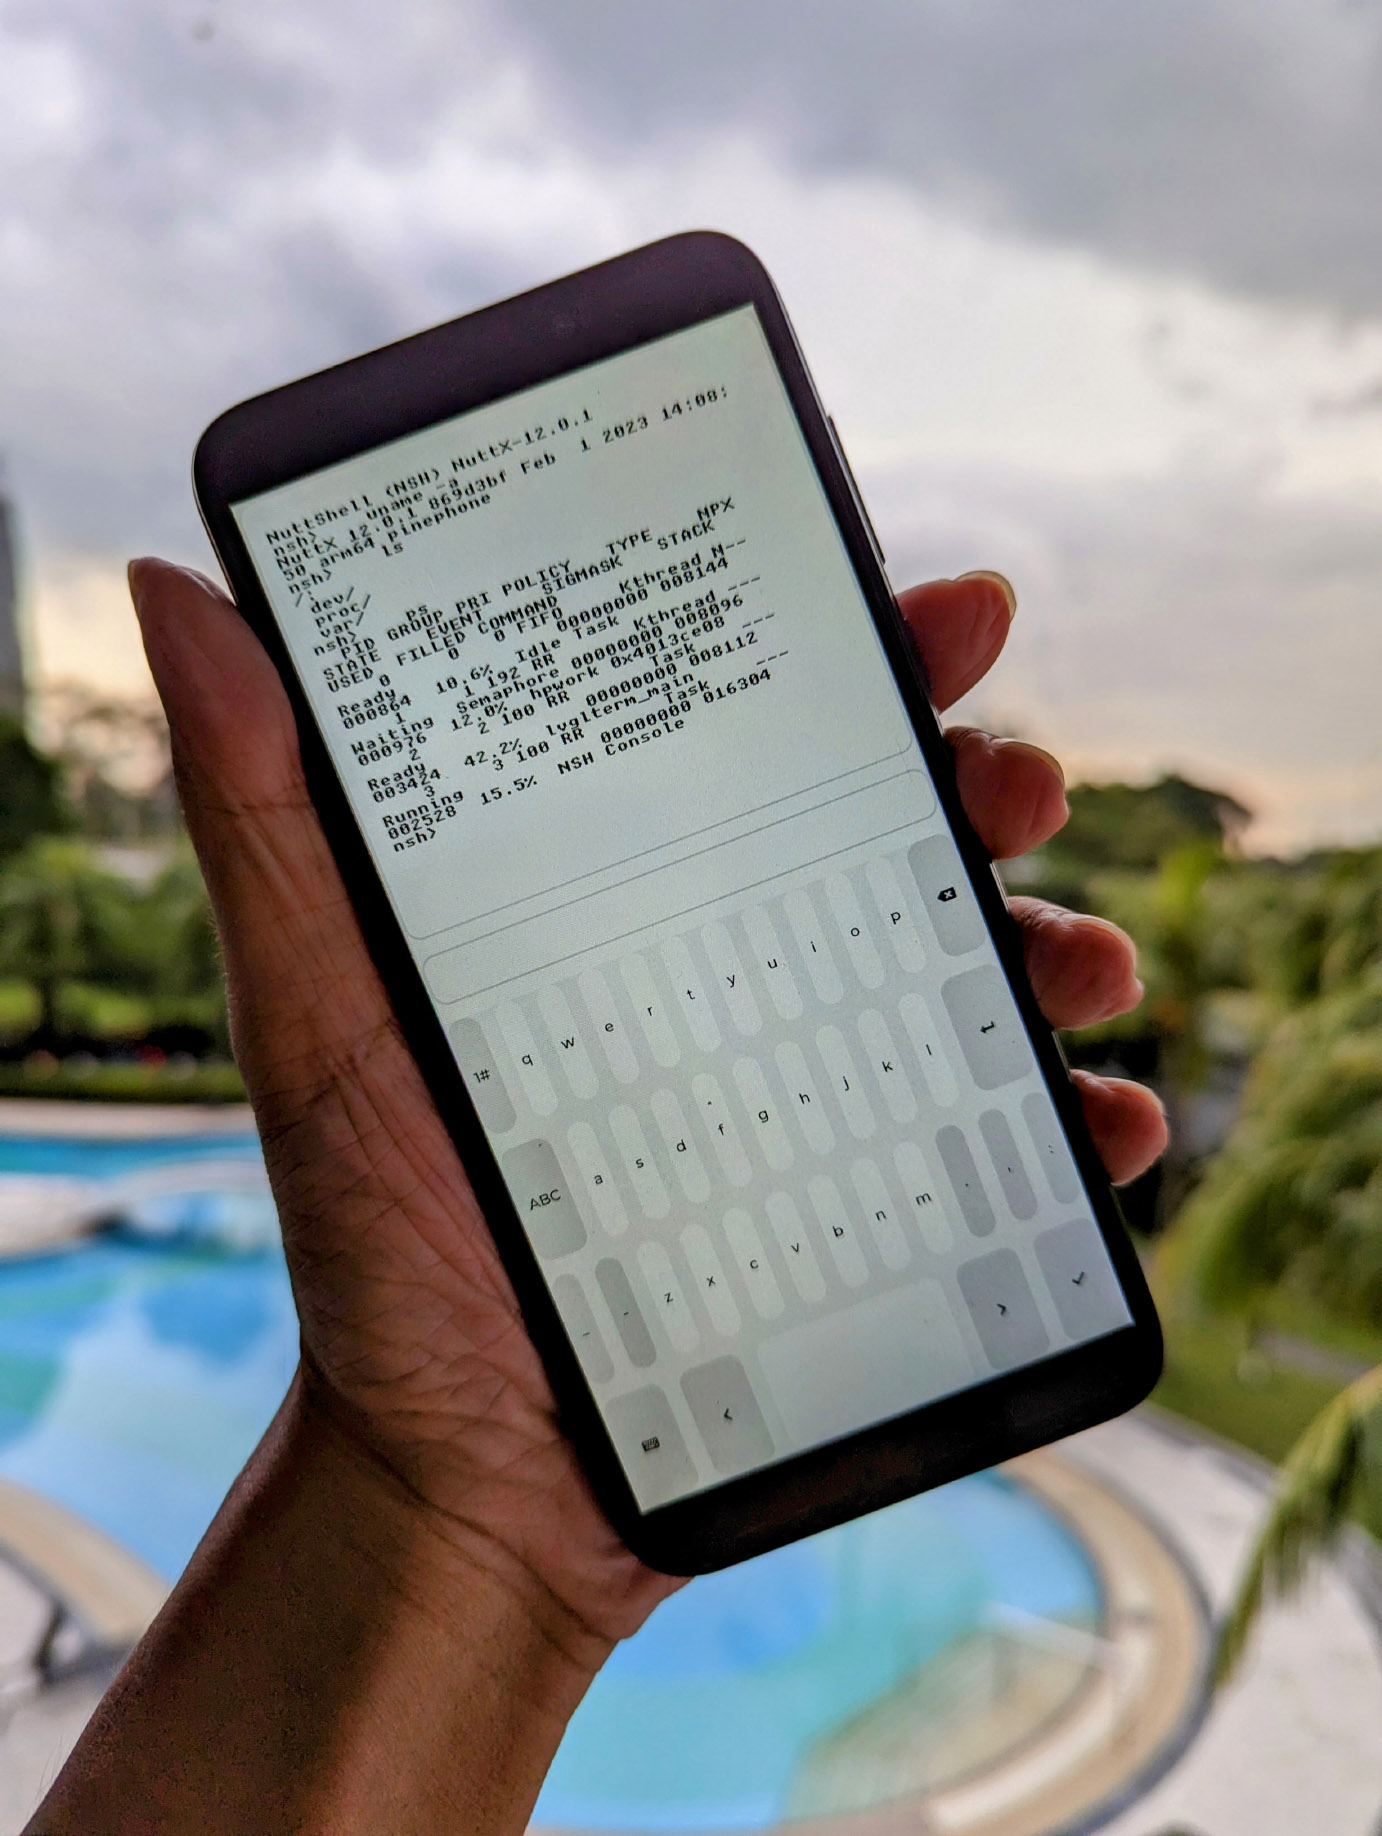
When we fix the fault, we expect NuttX to boot successfully to the NSH Command Prompt.
(Just like on PinePhone, pic above)
But what happens between arm64_chip_boot and NSH Command Prompt?
Let’s trace the NuttX Boot Sequence after arm64_chip_boot, so that we understand completely how PinePhone boots to the NSH Command Prompt…
Earlier we saw that arm64_chip_boot initialises the Arm64 Memory Management Unit. After that, it calls…
a64_board_initialize: To initialise the PinePhone “Board” (for LEDs)
a64_earlyserialinit: To configure the PinePhone Allwinner A64 UART Port (for Console Input / Output)
And returns to arm64_boot_primary_c_routine…
arm64_boot_primary_c_routine continues to boot NuttX Kernel and calls nx_start, which initialises a whole bunch of things…
Task Control Block (Idle Task)
Semaphore Facility
Memory Manager / Extra Heap
Input / Output Buffering
Unique Process IDs / Idle Group / Tasking Data Structures
File System
Interrupt Handling Subsystem
POSIX Timer Facility / Signal Facility
Named Message Queue Facility / System V Message Queue Facility
Networking System / Binary Loader System
Arm64 Hardware (up_initialize)
Common Drivers / Early Board Initialisation
Then nx_start runs the NuttX Tasks…
Start the remaining CPUs
Create the Initial Tasks
Bring Up the System (nx_bringup)
Enter the Idle Loop
And the NSH Command Prompt appears. We’ve just completed the entire Boot Sequence for NuttX on PinePhone!
(Hopefully we’ll generate the complete Call Graph someday!)
How does nx_bringup start the NSH Shell?
Check out the details here…
But wait… Who starts the other PinePhone Drivers?
Like the drivers for LCD Display, Touch Panel, Accelerometer, …
Ah this sounds surprising, but the other PinePhone Drivers are started by NSH Shell!
nsh_initialize does this…
// Perform architecture-specific initialization (if configured)
boardctl(BOARDIOC_INIT, 0);

// Perform architecture-specific final-initialization (if configured)
boardctl(BOARDIOC_FINALINIT, 0);
Which calls boardctl…
Which calls board_app_initialize…
Which calls pinephone_bringup…
Which starts the PinePhone Drivers
Alternatively, the PinePhone Drivers may be started in Auto-Launch Apps like LVGL Terminal.
Let’s head back to Unicorn Emulator and fix our Arm64 Exception…
Now that we understand how NuttX boots on PinePhone…
Can we fix the Arm64 Memory Management Fault on Unicorn?
Based on our earlier investigation with Unicorn Emulator…
We deduced that the Arm64 Address Translation (or Caching) has failed in our Emulated Arm64 Memory Management Unit for Exception Level 1.
(Invalid Arm64 Address Translation or Caching at 0x400C 3FFF)
From the Call Graph above, these are the functions involved in the Arm64 Address Translation Tables (and are probably sus)…
setup_page_tables: Setup Arm64 Page Tables
init_xlat_tables: Initialise Arm64 Translation Tables
set_pte_block_desc: Set Private Block Descriptor
calculate_pte_index: Calculate Private Index
To fix the fault, we’ll sprinkle some Debug Logs into the above functions. Stay tuned for updates!
(I might have missed a Memory Mapping at 0x400C 3FFF)
Without Emulation: Boxful of gadgets for auto-testing
Why would we need Daily Build and Test?
NuttX RTOS for PinePhone is still evolving, with frequent code changes.
That’s why it’s good to run an Automated Build and Test every day, to be sure that NuttX boots OK on PinePhone.
We need an actual PinePhone to run Daily Tests?
Hopefully not! It might get awfully messy to wire up a PinePhone with Sensors and Actuators to test the Touchscreen.
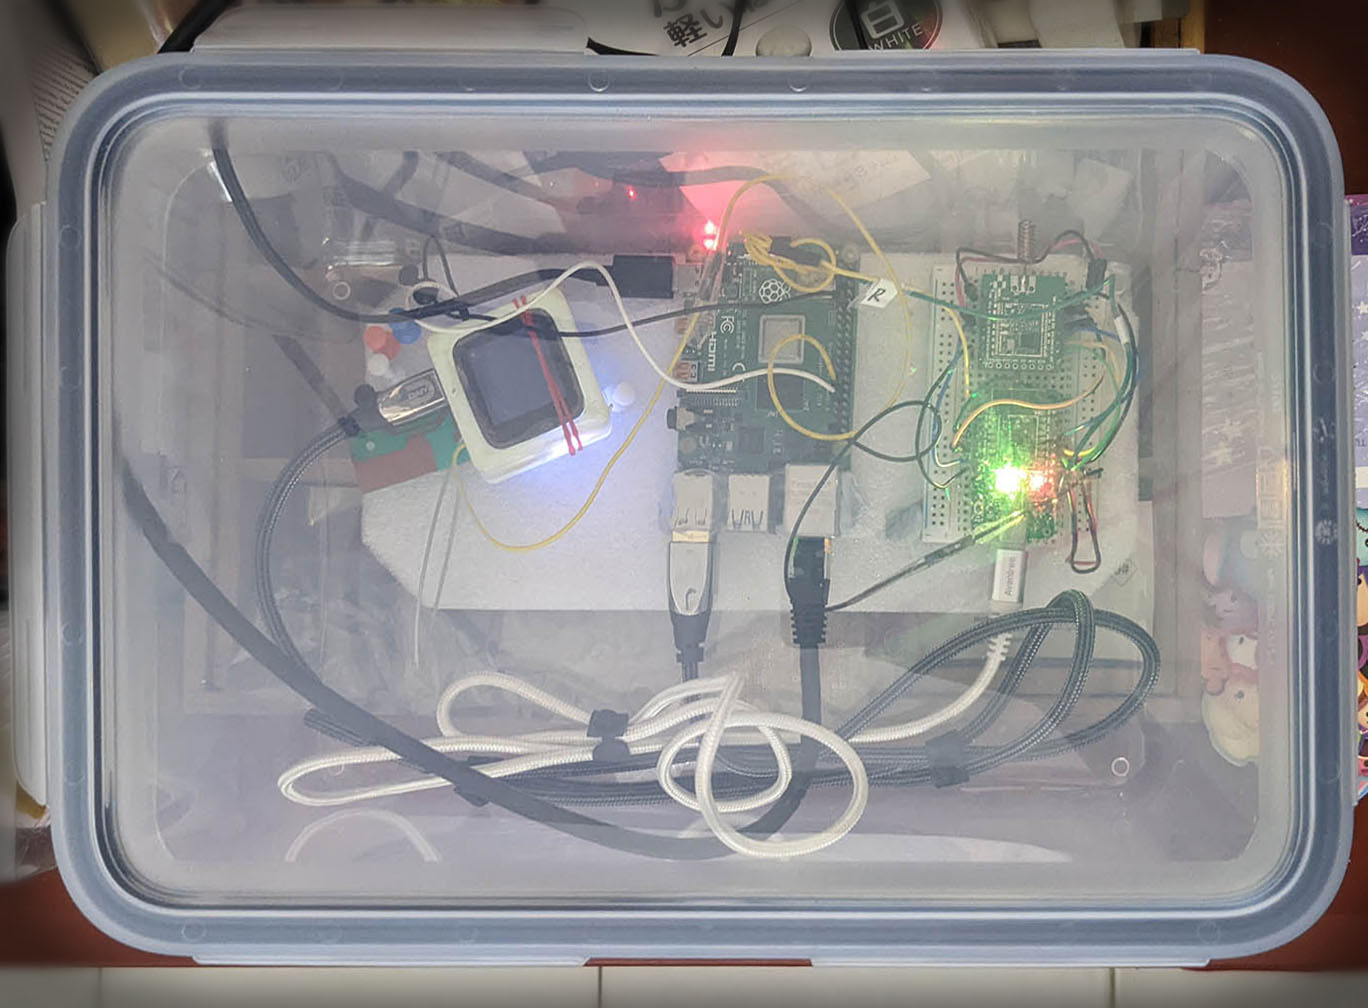
We tried Automated Daily Testing for a simpler microcontroller gadget (pic above)…
But for PinePhone we’ll do Automated Daily Testing the gadgetless way… With Unicorn Emulator!
How will we auto-build and test NuttX for PinePhone every day?
Our grand plan is to have GitHub Actions trigger these tasks every day…
Do a complete NuttX Build for PinePhone
Run the built NuttX Image with Unicorn Emulator
Generate the NuttX Call Graph in Rust
Match the Call Graph with some pattern
(With a Graph Matching algo?)
Publish the NuttX Image, Emulator Log and Clickable Call Graph
(As a GitHub Release)
Or maybe I’ll switch on my SBC every day to run all these. We’ll talk more in the next article!
We’ve done so much today…
Render the Clickable Call Graph for Apache NuttX RTOS, to understand how it boots…
By integrating Unicorn Emulator with the Rust Libraries addr2line and gimli, to map the Code Addresses to NuttX Kernel Functions
Thanks to the Call Graph, we walked through the complete Boot Sequence of NuttX for PinePhone
Unicorn might be helpful for Automated Daily Build and Test of NuttX for PinePhone
I hope you’ll join me in the next article as we implement the Automated Daily Build and Test of NuttX for PinePhone.
Many Thanks to my GitHub Sponsors for supporting my work! This article wouldn’t have been possible without your support.
Got a question, comment or suggestion? Create an Issue or submit a Pull Request here…
lupyuen.github.io/src/unicorn2.md
How does NuttX start the NSH Shell?
Earlier we stepped through the Boot Sequence for NuttX…
Right after that, nx_bringup calls…
nx_create_initthread, which calls…
nx_start_application, which starts a NuttX Task for…
What’s CONFIG_INIT_ENTRYNAME?
CONFIG_INIT_ENTRYNAME defines the Application Function that will be called at NuttX Startup.
How to configure CONFIG_INIT_ENTRYNAME?
In “make menuconfig > RTOS Features > Tasks and Scheduling”…
We normally set “Application Entry Name” to nsh_main
Which configures CONFIG_INIT_ENTRYNAME as…
CONFIG_INIT_ENTRYNAME="nsh_main"nsh_main is the function that runs the NSH Shell.
Eventually nsh_main will initialise the PinePhone Drivers…
Can we configure NuttX to start another app?
Yep we may set CONFIG_INIT_ENTRYNAME to another function like…
CONFIG_INIT_ENTRYNAME="lvgldemo_main"NuttX will start our LVGL Demo App when it boots.
(lvgldemo_main will also initialise the PinePhone Drivers)
Earlier we talked about parsing the DWARF Debug Symbols in the ELF File…
So that we can print the Function Names and Source Filenames for the Arm64 Code Addresses…
→ cargo run

hook_block:
  address=0x40080920
  size=12
  arm64_chip_boot
  arch/arm64/src/chip/a64_boot.c:82:1

hook_block:
  address=0x40080e50
  size=28
  arm64_mmu_init
arch/arm64/src/common/arm64_mmu.c:584:1Which we implemented like this: main.rs
// Get the ELF Context
let context = ELF_CONTEXT.context.borrow();

// Lookup the DWARF Frame for the Arm64 Code Address
let mut frames = context.find_frames(address)
  .expect("failed to find frames");

// Lookup the Source Location for the Arm64 Code Address
let loc = context.find_location(address)
  .expect("failed to find location");
What’s ELF_CONTEXT?
ELF_CONTEXT contains the Parsed Debug Symbols from our ELF File.
To parse the Debug Symbols, we call the addr2line, gimli and once_cell crates: Cargo.toml
[dependencies]
addr2line = "0.19.0"
gimli = "0.27.2"
once_cell = "1.17.1"
unicorn-engine = "2.0.0"
At startup, this is how we load the Debug Symbols from our NuttX ELF File into ELF_CONTEXT as a Lazy Static: main.rs
use std::rc::Rc;
use std::cell::RefCell;
use once_cell::sync::Lazy;

/// ELF File for mapping Addresses to Function Names and Filenames
const ELF_FILENAME: &str = "nuttx/nuttx";

/// ELF Context for mapping Addresses to Function Names and Filenames
static ELF_CONTEXT: Lazy<ElfContext> = Lazy::new(|| {
  // Open the ELF File
  let path = std::path::PathBuf::from(ELF_FILENAME);
  let file_data = std::fs::read(path)
    .expect("failed to read ELF");
  let slice = file_data.as_slice();

  // Parse the ELF File
  let obj = addr2line::object::read::File::parse(slice)
    .expect("failed to parse ELF");
  let context = addr2line::Context::new(&obj)
    .expect("failed to parse debug info");

  // Set the ELF Context
  ElfContext {
    context: RefCell::new(context),
  }
});

/// Wrapper for ELF Context. Needed for `Lazy`
struct ElfContext {
  context: RefCell<
    addr2line::Context<
      gimli::EndianReader<
        gimli::RunTimeEndian,
        Rc<[u8]>  // Doesn't implement Send / Sync
      >
    >
  >
}

/// Send and Sync for ELF Context. Needed for `Lazy`
unsafe impl Send for ElfContext {}
unsafe impl Sync for ElfContext {}
Why is ELF_CONTEXT a Global Static? Can’t we load it in the Main Function and pass it to Unicorn?
Yep that’s the cleaner way… But then we would have to pass ELF_CONTEXT to hook_block, which is a Callback Function. And it gets complicated.
We might pass our context to the Callback Function via a Rust Closure like this…